Telemetry-Driven QA: Use Observability Data to Prioritize API Coverage

TL;DR: We’ve shipped observability ingestion for API contract governance. Connect Datadog, Honeycomb, Amazon CloudWatch, or Google Cloud Monitoring to an OpenAPI service and TestChimp maps runtime routes to API operations, stores hourly and daily aggregate metrics, and brings request volume, error rate, status classes, and latency percentiles into the APIs surface.
The important part is not another dashboard. TestChimp’s QA workflows can now use the same telemetry to decide what to test next:
- Uncovered, high-volume operations move up the functional coverage queue.
- Uncovered operations with high error exposure move up faster.
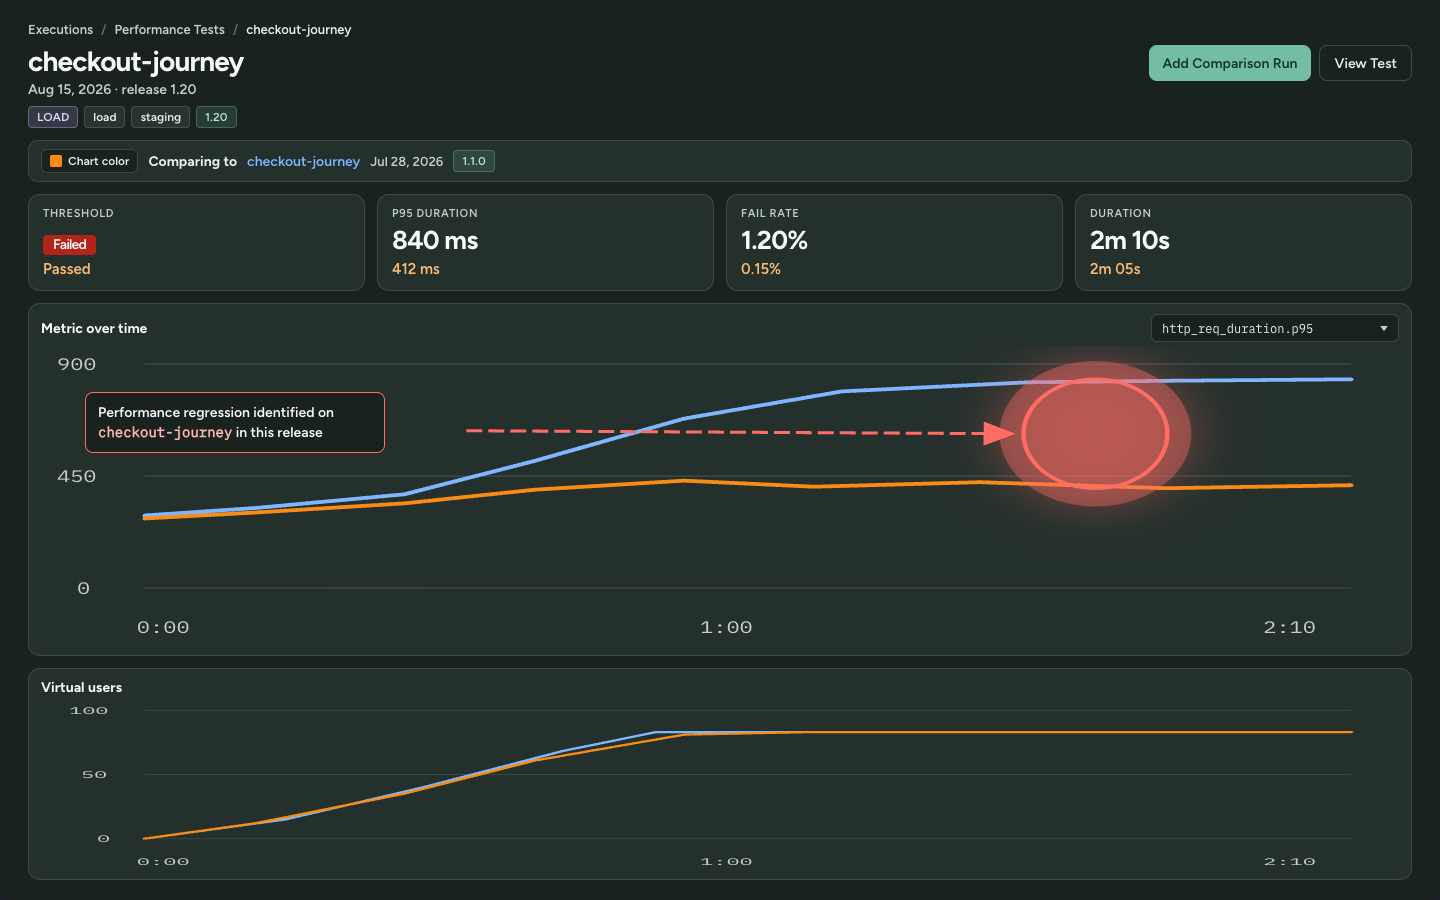
- High-p95 or high-p99 operations become candidates for performance-test creation and upkeep.
Production telemetry becomes a prioritization signal for QA—not a substitute for tests, and not an excuse to copy production traffic into a load profile.
Product guide: Observability in API Contract Governance.
Most QA backlogs know what is uncovered. They do not know what matters.
OpenAPI coverage can tell you that 80 operations have weak coverage. Execution history can tell you that a test failed yesterday. A requirements graph can tell you which scenarios the team marked high priority.
All useful. Still incomplete.
If one uncovered endpoint handles 40% of production requests and another is called twice a month, they are not the same risk. If a mapped operation is returning errors on meaningful traffic, “we should test this someday” is no longer an honest prioritization. If p95 latency is already elevated, a green functional check does not answer whether the path stays healthy under concurrency or real tenant volume.
The usual QA process flattens these into one queue:
| Signal | What teams often do | What a telemetry-driven process does |
|---|---|---|
| Missing API coverage | Sort by endpoint name or whoever complained last | Rank by traffic and failure exposure |
| High error rate | Treat it as an operations-only concern | Strengthen negative-path and response-code coverage |
| Elevated p95 / p99 | Wait for an incident or quarterly performance pass | Prioritize a relevant k6 journey or upkeep |
| No telemetry | Assume the endpoint is unused | Mark it unknown; use business criticality and code evidence |
Telemetry-driven QA closes that context gap. It uses production-like runtime evidence to optimize the order in which the QA process spends human attention, agent tokens, test runtime, and performance-environment budget.
What TestChimp now ingests
TestChimp performs read-only aggregate queries against the configured observability provider. It does not copy raw traces, logs, request bodies, credentials, or customer payloads into the QA context.
The flow is:
- Discover observed routes from the previous 24 hours.
- Map method + route templates onto operations in the selected OpenAPI service.
- Surface unmatched runtime routes as Unmapped contract drift.
- Collect aggregate metrics for each completed hour.
- Store a complete prior-UTC-day summary with request count, average RPM, error count and rate, HTTP status classes, and p50 / p95 / p99 latency.
- Show the latest finalized daily summary in the APIs list, with the latest persisted hourly result as a fallback while daily data is not yet available.
That gives each mapped API operation two distinct evidence sets:
- Contract coverage — which operations, fields, and response codes SmartTests or API tests actually exercised.
- Runtime observability — how much traffic reached the operation, how often it failed, and how its latency was distributed.
Observability does not make an endpoint covered. Coverage does not prove the endpoint is important. Put them together and the QA queue gets much smarter.
Setup guides: Observability integrations · Datadog · Honeycomb · CloudWatch · Google Cloud Monitoring.
How should telemetry prioritize functional API coverage?
Start with the coverage gap. Then use telemetry to order the queue.
1. Missing coverage is the eligibility signal
Find operations with no covering tests or weak request-field, response-field, and response-code coverage. Intentionally ignored gaps stay out of the active queue.
2. Request volume is the impact signal
Among uncovered operations, prioritize high request count or RPM. A regression on a hot operation has a larger blast radius than the same bug on a dormant path.
This does not mean “only test popular endpoints.” Authentication, billing, destructive actions, and compliance paths can remain critical at low volume. Telemetry improves ordering; it does not replace product judgment.
3. Error exposure is the urgency signal
Raise operations with high error rate, high absolute error count, or meaningful 5xx traffic. Then inspect the contract detail:
- Is the failing response code represented in the OpenAPI spec?
- Does any SmartTest exercise it?
- Are error-body fields and recovery behavior asserted?
- Does the operation have an auth, role, validation, or state-transition branch that the happy path never reaches?
The goal is not to write one API test per metric. Prefer extending an existing UI or API test that already reaches the operation and can exercise the missing branch naturally.
4. Business criticality breaks ties
Volume and errors are evidence, not governance. Use scenario priority, release scope, semantic coverage, incident history, and backend branch complexity alongside telemetry.
A practical ordering is:
missing coverage
  + request volume / error exposure
  + business criticality
  + distinct branch complexity
That is how /testchimp create tests, /testchimp run QA, and /testchimp upkeep now
reason about API coverage when observability is available.
How should latency telemetry prioritize performance testing?
Functional testing asks whether the operation behaves correctly. Performance testing asks whether the journey remains healthy under an approved workload and dataset.
Use runtime p95 and p99 latency to identify:
- A slow operation with no corresponding k6 journey.
- A hot operation whose performance coverage exists but has gone stale.
- A high-error operation where latency, queueing, timeouts, or dependency behavior may be contributing.
- A list, search, report, export, or history path that may need a volume test against a large seeded dataset—not merely more concurrent users.
The workflow mapping is deliberate:
/testchimp create-perf-testsauthors a scenario-linked journey when a high-value operation has no useful performance representation./testchimp upkeep-perfreviews stale journeys, baselines, datasets, dependency mocks, and composite membership—with slow, high-volume, and high-error operations first./testchimp run-perf-testscan use the signal to choose among related journeys for a PR or release scope.
This is performance-test prioritization, not automatic capacity planning.
Production request rates do not become k6 VUs. Production p95 does not silently become a threshold. Absolute concurrency, duration, dataset cardinality, SLOs, and pass/fail limits still come from your capacity model and approved policy.
And production p95 is not directly comparable to test p95 unless environment, workload, time window, dataset, code/config, and dependency behavior genuinely match. Otherwise the comparison is directional context—not a regression claim.
Full workflow guide: Performance Testing Workflows.
Agents can consume the same evidence
The APIs UI is not the end of the data path.
TestChimp’s API-operation list and detail APIs return observability mapping state plus the latest persisted runtime summary. The TestChimp CLI and MCP tools expose those same responses to agents:
list-api-operations
get-api-operation-detail
The summary includes its time window and sync status alongside request volume, errors, status classes, and latency percentiles. That matters because agents need to reason about data quality, not merely sort numbers.
Our skill playbooks now instruct QA workflows to:
- Fetch API contract coverage and runtime observations together.
- Check the observation window and sync status.
- Treat absent, stale, partial, no-data, or query-failed telemetry as unknown, not zero.
- Prioritize uncovered high-volume and high-error operations for functional coverage.
- Prioritize high-p95 / high-p99 operations for performance creation or upkeep.
- Keep production observations separate from test thresholds and baseline comparisons.
This is the useful version of “AI-powered testing”: not a model generating more scripts, but an agent allocating QA effort from evidence.
The optimization target is the QA process
Observability platforms already help teams operate production. We are using the same aggregate evidence for a different question:
Given limited QA time and runtime, which uncovered behavior should we protect next?
That creates a tighter feedback loop:
OpenAPI contract
      +
test coverage
      +
runtime volume, errors, and latency
      ↓
prioritized QA workflow
      ↓
tests, fixtures, performance journeys, or accountable issues
      ↓
new execution evidence
The point is not to maximize test count. It is to optimize the QA process around expected impact.
This sits alongside TrueCoverage:
- TrueCoverage uses semantic product events to show which user journeys, transitions, and world-state slices deserve protection.
- API observability uses route-level volume, errors, and latency to show which contract operations deserve functional and performance attention.
Requirements say what should matter. Tests say what was proven. Telemetry says where the product is carrying real load and risk. Agentic QA gets better when it can reason across all three.
Frequently asked questions
What is telemetry-driven QA?
Telemetry-driven QA uses runtime signals such as request volume, error rate, and latency percentiles to prioritize test creation, maintenance, and execution. It optimizes which QA work happens first; it does not replace requirements, tests, or human risk policy.
Does TestChimp ingest raw traces or request payloads?
No. TestChimp runs read-only aggregate queries and stores route mappings plus hourly and daily metric summaries. Raw provider events, logs, traces, and request bodies are not copied into TestChimp.
How does observability improve API test coverage?
Among uncovered API operations, TestChimp workflows prioritize fresh high-volume and high-error operations, then inspect field and response-code gaps to extend an existing test or author focused coverage.
How does observability improve performance testing?
p95 and p99 latency identify operations that need a k6 journey or performance upkeep. Request volume and error exposure strengthen that priority. Telemetry selects what to test; your policy still defines VUs, duration, datasets, and thresholds.
What happens when an operation has no observability data?
It is unknown, not zero traffic. The workflow falls back to business criticality, scenario priority, code/release impact, semantic coverage, and execution history.
Can production latency be used as a k6 threshold?
Not automatically. Production and test measurements usually differ in environment, workload, data, dependencies, and time window. Set k6 thresholds from explicit SLOs or an approved capacity policy, and compare runs only across compatible dimensions.
Try it
- Configure API Contract Governance with your OpenAPI root.
- Connect an observability provider.
- Map its service/resource to the matching OpenAPI service and run Sync now.
- Open APIs and sort/filter coverage alongside RPM, error rate, and p95 latency.
- Use Create test,
/testchimp create tests, or/testchimp upkeepfor high-impact coverage gaps. - Use
/testchimp create-perf-testsor/testchimp upkeep-perffor slow, hot, or error-prone operations that lack current performance evidence.
Start here:
- Observability in API Contract Governance
- API Contract Governance
- Operations list
- Create Tests
- Create Performance Tests
- Upkeep Performance Tests
- TestChimp skill
Do not let the test backlog decide its own order. Let evidence tell the QA process where risk is concentrated—then make the work accountable.