Dashboard
In brief: The QA Intel dashboard is your control-plane overview—planning coverage, automation health, exploration activity, and bug trends filtered by environment, release, and time.
The Dashboard is the platform homepage—reach it by clicking the logo in the app. It gives a high-level view of QA health across three areas: test planning, test automation, and exploratory testing. All metrics respect the current Execution scope (environment + release + time range).
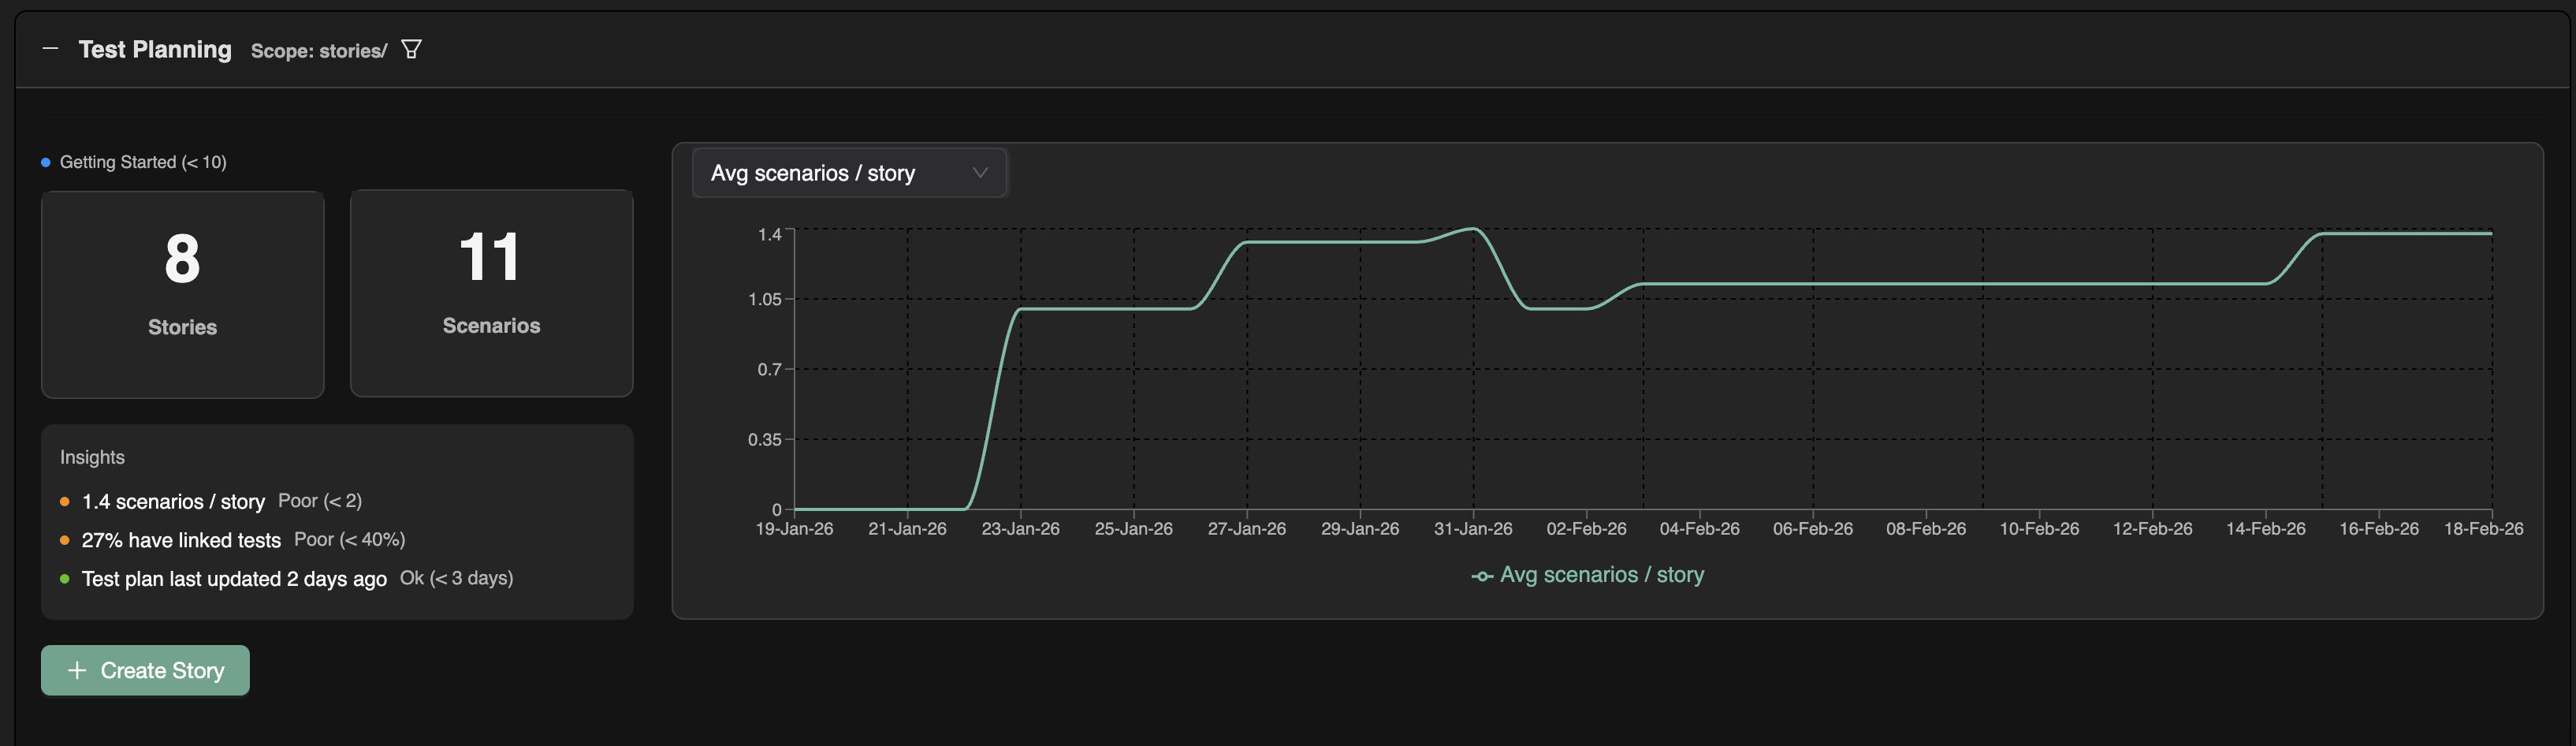
1. Test planning
This section focuses on test-plan coverage and linkage:
- Core metrics: Number of stories, number of scenarios, average scenarios per story, percentage of scenarios with linked tests, and related stats.
- Trends: Graphs show how each metric changes over time so you can spot improvements or regressions.
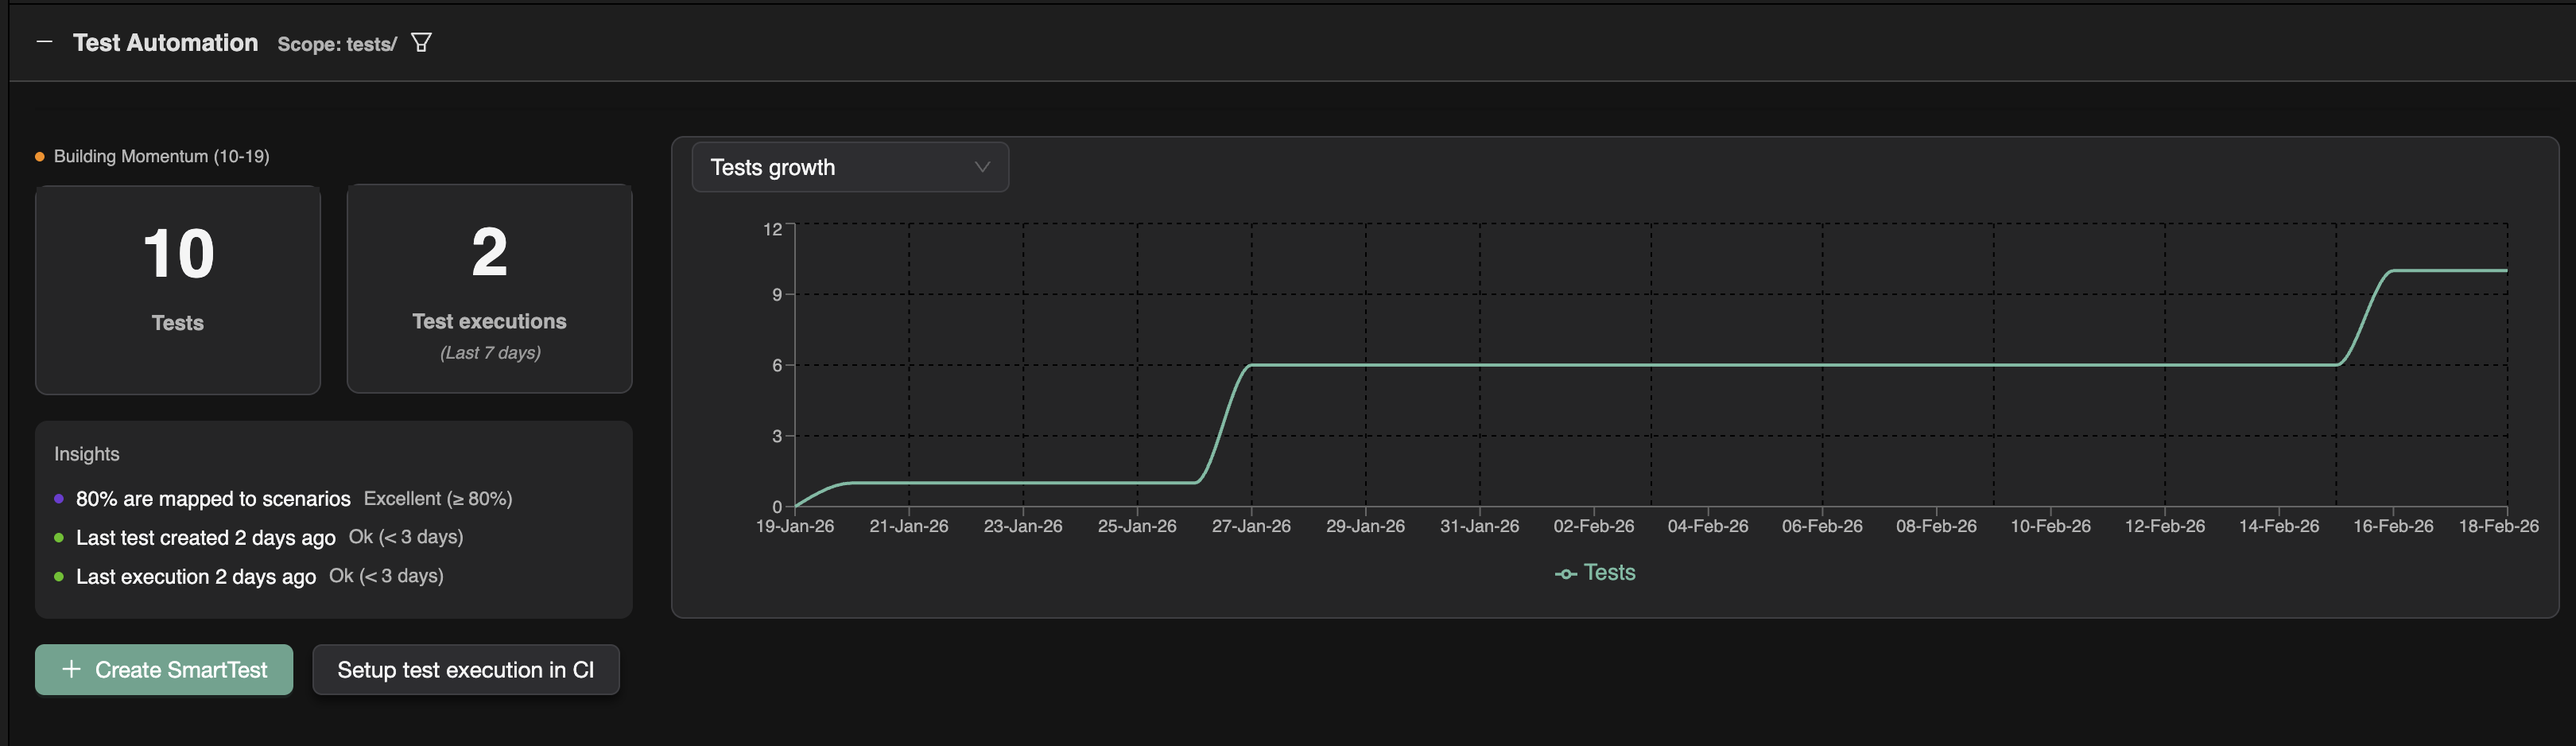
2. Test automation
This section focuses on tests and executions:
- Core metrics: Number of tests, number of executions, and key stats such as the percentage of tests with no scenarios linked.
- Graphs: Execution history over time and test-suite growth.
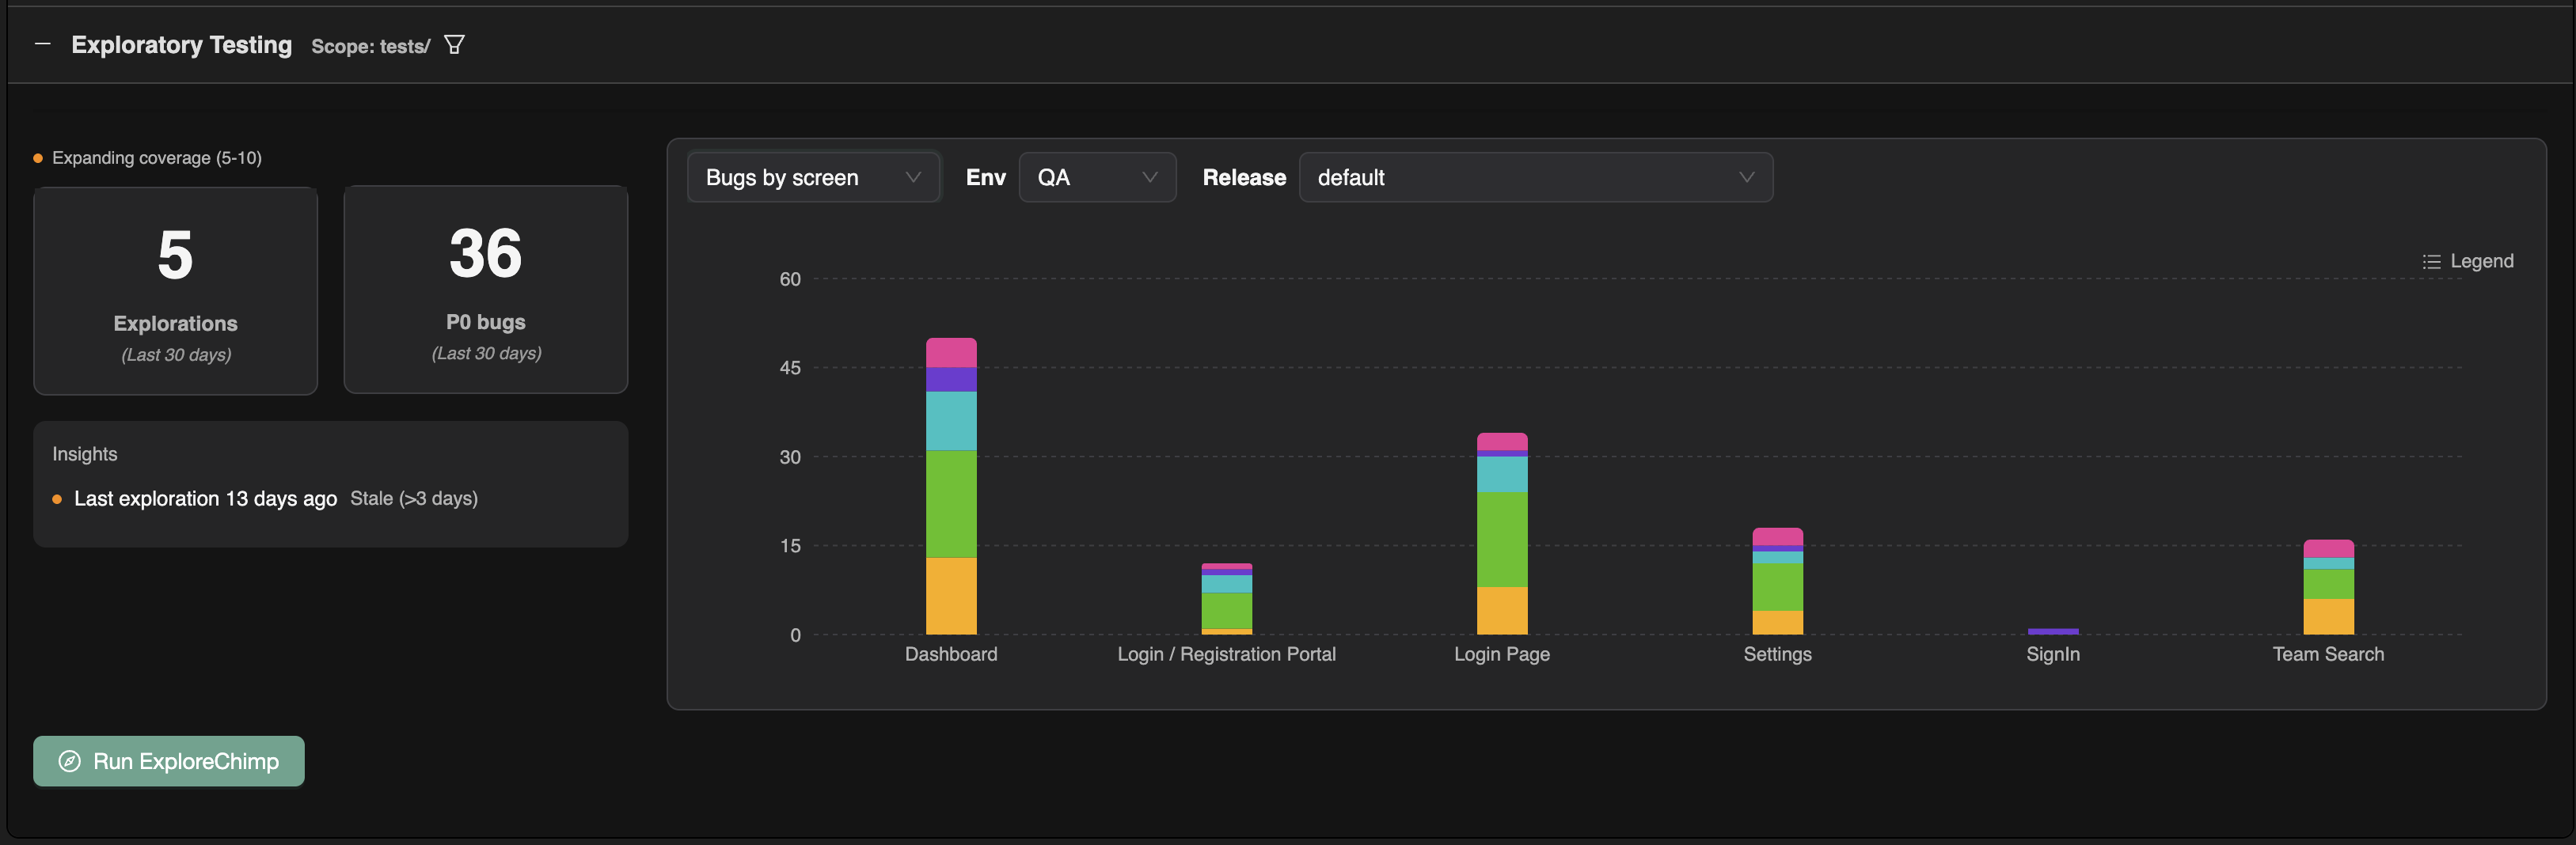
3. Exploratory testing
This section focuses on exploratory runs and findings:
- Core metrics: Number of explorations run, number of bugs found.
- Graphs: Bug breakdown by screen and by category.
Together, these three sections give a single entry point to understand how test planning, automation, and exploration are performing within the selected execution scope.
FAQ
How do I change the execution scope?
Pick environment, release, and time range filters applied across dashboard widgets and linked intel surfaces.
What should startup leads watch weekly?
Unlinked scenario trends, CI failure rates, new exploration bugs on hot paths, and TrueCoverage gaps on frequent events.
Does the dashboard replace /testchimp audit?
Dashboard summarizes trends; /testchimp audit gives agents a structured repo-level health narrative for action.