Test Runs
In brief: Test runs let teams execute scenarios from plans, record results against environments and releases, and feed QA intelligence alongside CI SmartTest executions.
Overview
A Test Run in TestChimp is a named, scoped campaign for validating your product — the same concept as a Test Run in TestRail, a Run in Qase, or a Test Set execution in PractiTest. You define which scenarios are in scope, associate manual and automated executions as they happen, and track progress toward completion in one place.
Test runs are the operational unit inside Release Management—create them from a release viewer to pre-fill version and scope, then roll progress into release intelligence alongside manual and CI evidence.
Unlike a single automation batch or manual session, a test run spans both execution types and rolls up scenario status across every linked execution.
Video guide
Watch a walkthrough of creating test runs, linking executions, and tracking progress:
What is a test run?
A test run answers: “For this release, sprint, or regression cycle — which scenarios must we validate, and how far along are we?”
| Concept | In TestChimp |
|---|---|
| Scope | Selected folders and files from your test plan (plans/stories and plans/scenarios) |
| Executions | Linked automation batches and manual sessions (many-to-many) |
| Progress | Per-scenario status: Passing, Failing, or Not attempted (based on the latest linked execution per scenario) |
| Lifecycle | Active → Completed or Archived |
Test runs sit alongside individual execution records. Executions → Automation Batches and Executions → Manual Sessions remain the detailed history of each run; Test Runs is where you plan the campaign and see aggregate progress.
Creating a test run
Open Test Runs from the main sidebar and click New Test Run. The create wizard has two steps.
Step 1 — Details
| Field | Required | Purpose |
|---|---|---|
| Title | Yes | Human-readable name (e.g. “Sprint 42 regression”, “v2.1 release sign-off”) |
| Environment | No | Filter and label executions (e.g. QA, Staging) |
| Release | No | Tie the run to a specific release version |
| Git branch | No | Optional branch context when linking CI or manual work |
| Due date | No | Shown on the list and viewer; overdue active runs are highlighted |
| Collaborators | No | Team members assigned to the run; each receives an email with a link to the viewer |
Step 2 — Scope
Select which parts of your test plan belong to this run using the plans folder tree:
- Stories root (
plans/stories) and Scenarios root (plans/scenarios) are selected by default. - Check or uncheck folders and individual files at any level.
- Selecting a parent folder includes everything beneath it — you do not need to select every child folder individually.
Only scenarios within the defined scope appear in the test run viewer. Scope aligns with how user stories and scenarios are organized in folders, so a run can target a feature area, a release slice, or the full plan.
After saving, the run appears in the Test Runs list with status Active.
Linking executions to a test run
Executions are linked after they occur (or at capture time for manual sessions). A single automation batch or manual session can belong to multiple test runs, and a test run can include many executions.
Automation batches
From Executions → Automation Batches:
- In the batch list, click the link icon in the Actions column for a batch.
- Or open a batch in the batch viewer and use the same Link to test runs action in the header.
The mapping modal lists active test runs. Filter optionally by git branch, environment, and release. Select one or more runs and click Save. Existing links are pre-selected so you can add or remove associations.
Manual sessions
At capture time (Chrome extension):
- Open the Chrome extension and click Create Manual Test Record.
- Choose your scenario (or open-ended objective) and branch as usual.
- Optionally select Test Run from the dropdown — only active runs are shown, grouped as:
- Assigned to me — runs where you are a collaborator
- Other — remaining active runs
- Start capture; the finished session is linked to the selected test run automatically.
After capture (web UI):
- From Executions → Manual Sessions, use the link action on a row.
- From a manual session viewer, use Link to test runs in the metadata row.
The same mapping modal used for automation batches applies here.
Viewing test run progress
Click a test run title in the list to open the test run viewer.
List view
The Test Runs list supports an Execution scope filter (environment, release, branch, date range) so you can focus on runs relevant to your current context. Each row shows metadata, status, due date, and a compact pass / fail / not attempted bar chart.
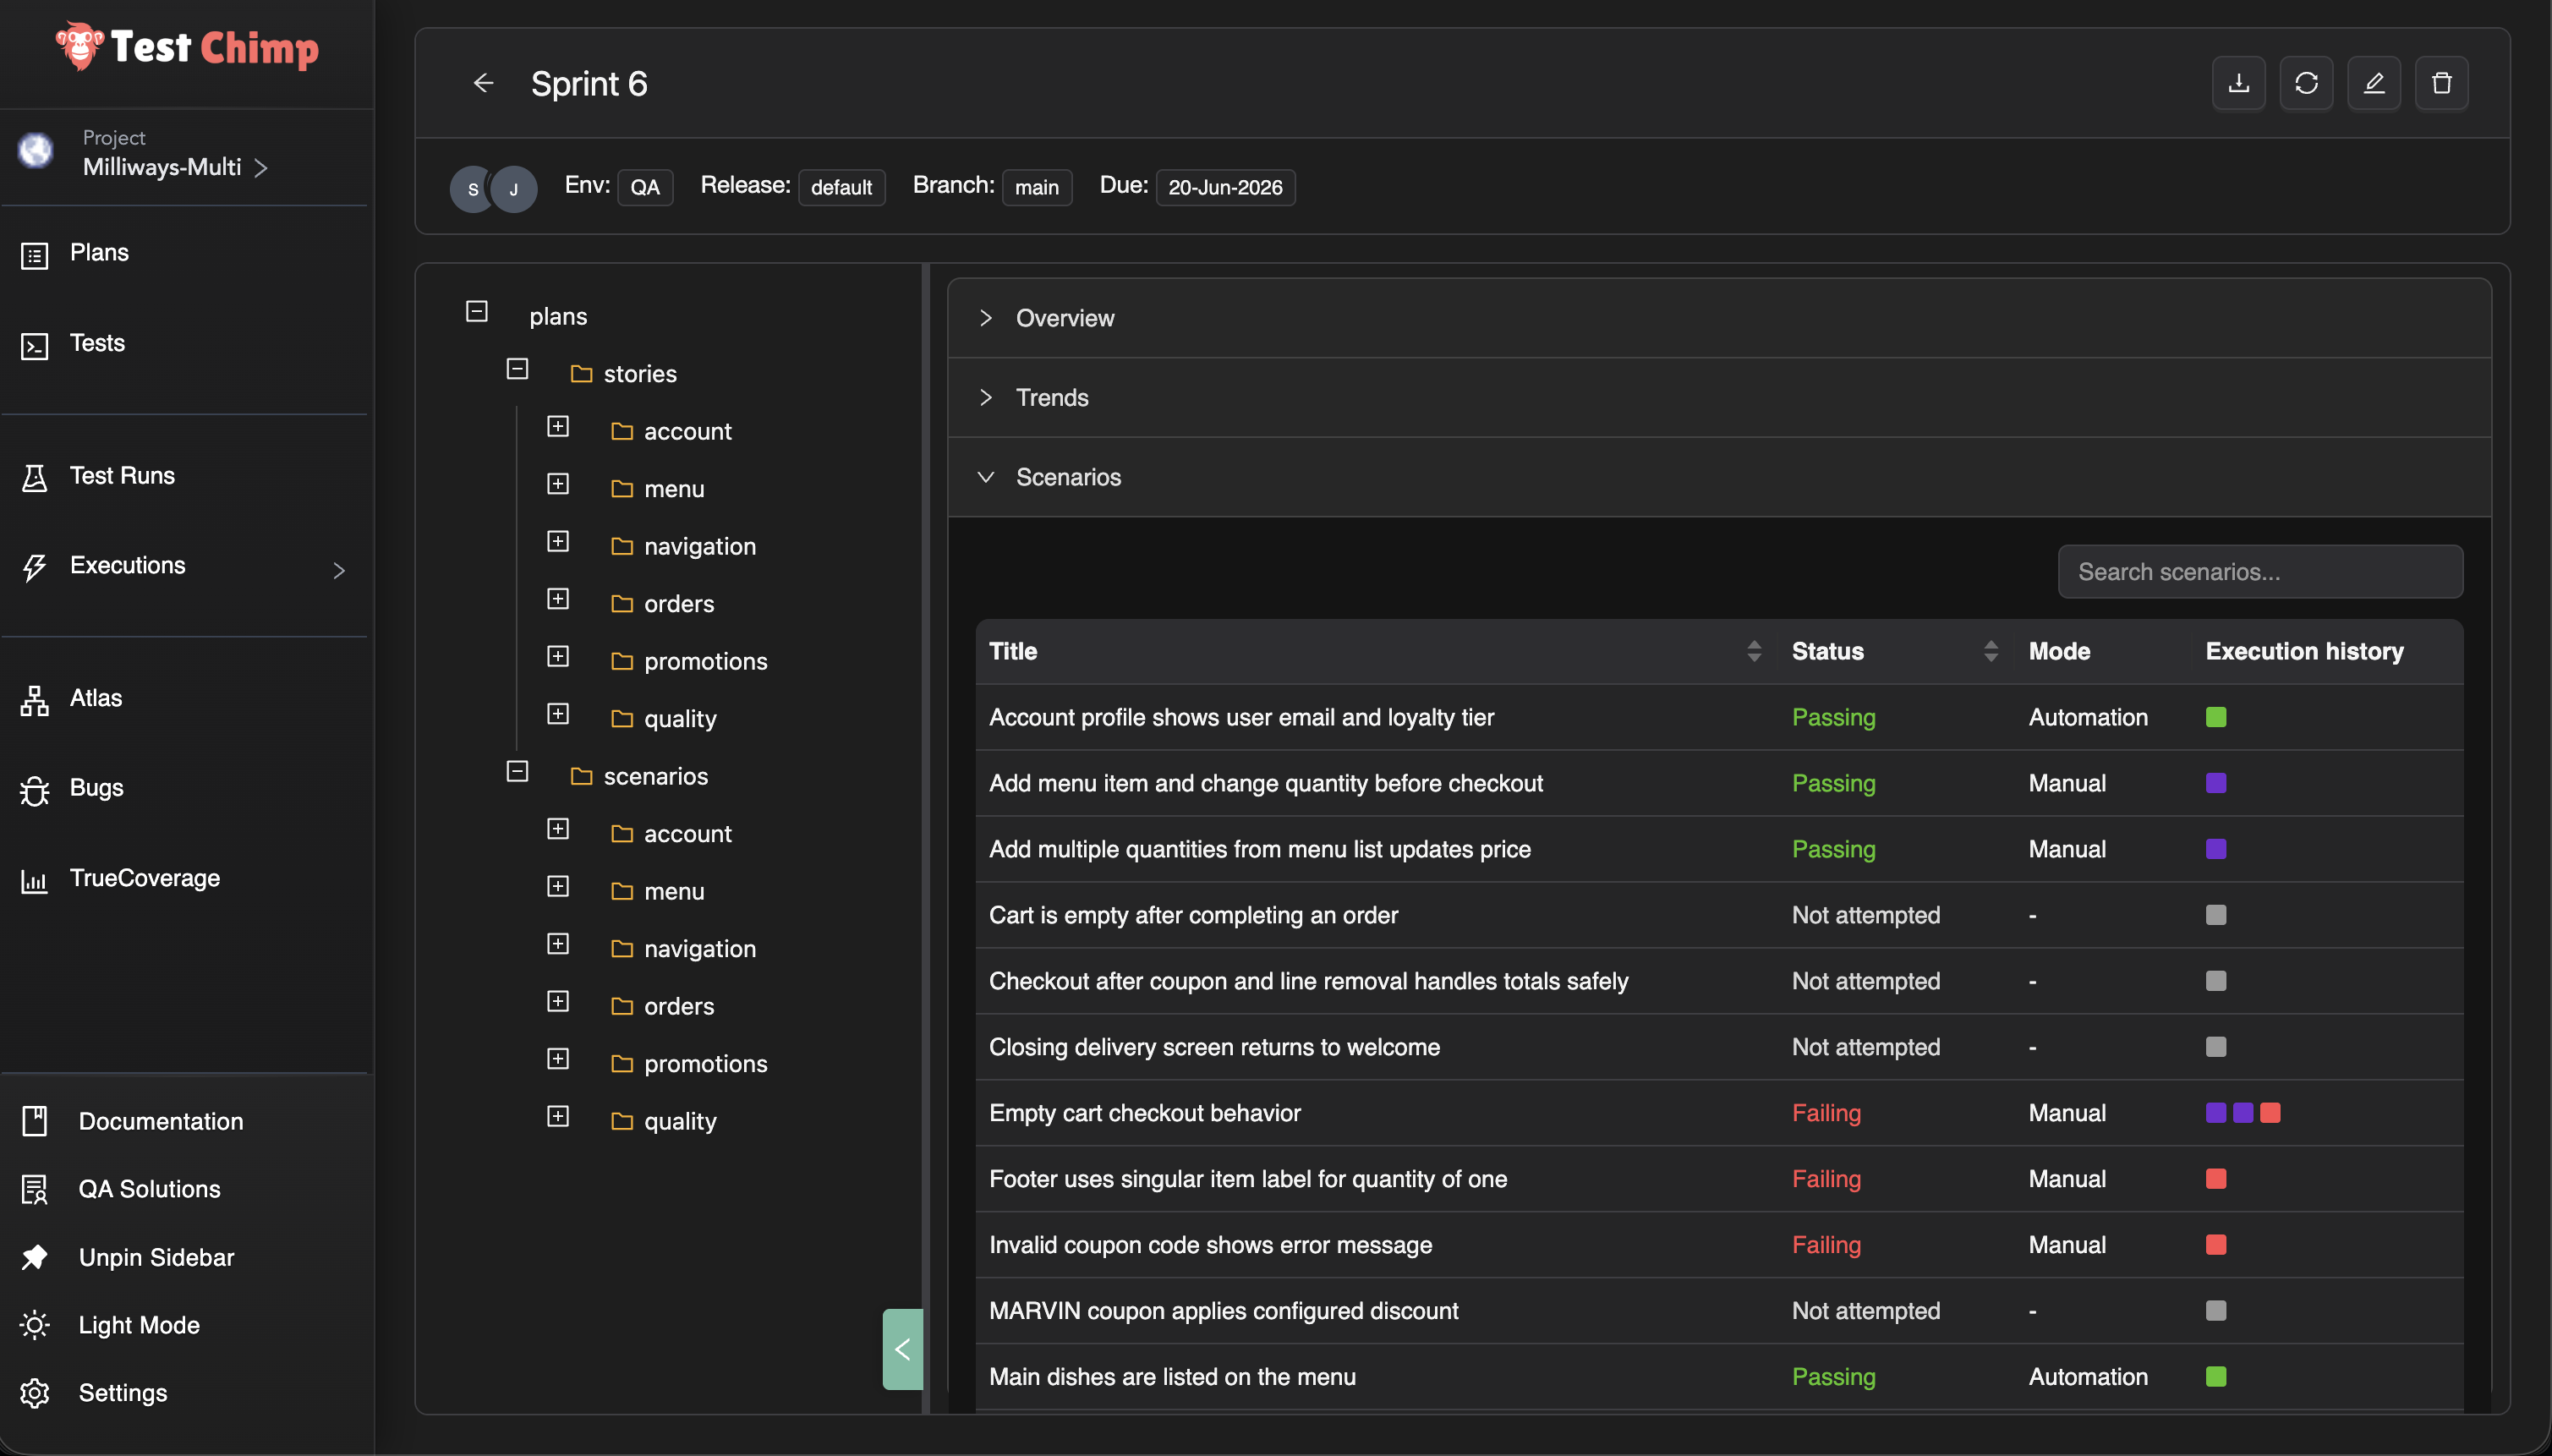
Test run viewer
The viewer has three main areas:
Header — Title, collaborators, environment, release, branch, and due date. Actions include refresh stats, edit definition, download PDF report, and archive.
Folder explorer (left) — The same stories and scenarios tree used in Test Planning. Selecting a folder or file scopes everything on the right to that subtree.
Insights accordion (right) — Three tabs:
Overview
- Pie chart and summary counts for Passing, Failing, and Not attempted scenarios in the current folder scope.
- Counts reflect the latest execution per scenario across all linked automation batches and manual sessions.
Trends
- Line chart over time for the scoped scenarios.
- Toggle between # of tests by status (absolute counts) and % of tests by status (percentages).
- Useful for daily standups and release readouts — see whether the run is converging or regressing.
Scenarios
- Table of every in-scope scenario for the selected folder/file filter.
- Columns include Title, Execution mode (Automation / Manual / Unknown), Status, and Execution history.
- Execution history shows colored squares for each linked execution (same pattern as requirement traceability); click a square to open that execution.
- Search scenarios by title.
- Mark a scenario Passing or Failing directly from the table when you need to record an outcome without a full manual capture session.
Use Refresh stats after linking new batches or sessions to recalculate aggregates.
Folder-based scoped views
Traditional test management tools often present test runs as a flat list of cases. TestChimp inherits the folder hierarchy from test planning as code:
plans/
├── stories/
│   ├── authentication/
│   └── checkout/
└── scenarios/
    ├── authentication/
    └── checkout/
Because stories and scenarios live in folders, a test run viewer can answer questions at any granularity:
| Question | How |
|---|---|
| “How is the whole run going?” | Leave the explorer at root — Overview and Trends cover all in-scope scenarios |
| “Is checkout ready to ship?” | Select checkout/ in the explorer — stats and scenario list filter to that module |
| “What’s left on login?” | Select authentication/login.md or the login scenario folder |
This mirrors how teams think about ownership and release slices — a QA lead tracks the full run, while feature teams drill into their folder without changing the run definition.
The same scope tree is used when creating the run (step 2 of the wizard) and when viewing progress (left explorer), so definition and reporting stay aligned.
Lifecycle and status
| Status | Meaning |
|---|---|
| Active | Run is in progress; executions can be linked; appears in Chrome extension and mapping modals |
| Completed | Run is finished; can be reopened as Active from the list actions menu |
| Archived | Hidden from the list; use when a run is no longer needed |
From the list Actions menu you can also Update definition (edit title, scope, collaborators, and metadata) without losing linked executions.
How test runs relate to traceability
Test Runs and Requirement Traceability share the same underlying scenario coverage model:
- Requirement traceability in Test Planning shows coverage for a folder over a time range and execution scope.
- Test runs add a named campaign with explicit scope, collaborators, due dates, and a dedicated progress dashboard fed by linked executions.
Use traceability for ongoing product health; use test runs when you need a time-bound validation cycle (release, sprint, audit, or regression).
Related documentation
- Release Management — Releases, sign-off, and release intelligence
- Manual sessions to test runs — Chrome extension workflow for release evidence
- Linking automation batches — CI batches on a release
- Test Planning as Code — Folder organization for stories and scenarios
- Requirement Traceability — Coverage at any folder level
- Manual Test Session Capture — Recording sessions and linking to test runs from the extension
- Run SmartTests in CI (Playwright) — Automation batches that can be linked to test runs
FAQ
How do test runs relate to CI?
CI SmartTest executions report automatically via @testchimp/playwright; test runs cover planned manual or ad-hoc execution in the same insight model.
Can I scope runs to a release?
Yes—pick environment and release so dashboards and insights filter to the execution scope you care about.
Do runs update traceability views?
Executions against linked scenarios appear in Test Planning and SmartTests Insights with pass/fail and history trends.