How It Works
In brief: TrueCoverage compares event streams from a base scope (e.g. production) to a coverage scope (test runs)—computing frequency, dwell, drop-off, depth, and transition gaps.
TrueCoverage is built on events emitted in user sessions, collected by the platform RUM SDK (@testchimp/rum-js on web, testchimp-rum-ios / testchimp-rum-android on native), and aligned with test runs via @testchimp/playwright. This page explains those core ideas and the analytics metrics we compute.
Scope: The pipeline applies to web, iOS, and Android once instrumentation and test wiring from Instrumenting your app are in place. Mobile testing covers Mobilewright test authoring; use both when building native TrueCoverage end-to-end.
Core Ideas
Events in User Sessions
- Events represent key user actions—e.g.
send-message,checkout,add-to-cart—not low-level UI interactions likeclick-buttonorclose-modal. You instrument your app to emit these events so they can be analyzed across sessions. - Events are emitted in user sessions (browser or app sessions). Each session has a sequence of events with timestamps; we aggregate and analyze them per day.
Test Alignment
The @testchimp/playwright augments event emits automatically with test identification details (e.g. test file, test name, run id)—via page metadata on web and automation deep links on iOS/Android when TESTCHIMP_PROJECT_TYPE is set correctly. That allows TestChimp to:
- Record the same event taxonomy during test execution as in production (or any other environment).
- Align test execution results with the events recorded across different environments.
- Overlay “coverage” (which events were emitted during test runs) on top of “base” behaviour (e.g. production) to show coverage gaps.
So you get one consistent event model for both real users and tests, and can see exactly which user behaviours are covered by tests.
The 4Ds of RUM-based QA Strategy
TrueCoverage organizes event-level insights into four categories that guide how you prioritize testing:
| Category | What it answers | Why it matters for QA |
|---|---|---|
| Demand | Which actions users perform most often. | Covering these in tests protects core user journeys from regressions. |
| Duration | Where users spend the most time. | Prioritize deeper testing here, including variations and alternative paths. |
| Drop-off | Where users abandon sessions. | Check test coverage to rule out bugs and investigate potential usability issues. |
| Depth | How deep into a session users typically reach a given feature. | Ensure top-of-funnel events are well tested, since they gate the rest of the user journeys. |
The metrics below are computed per event type and map into these categories. All are per day (daily aggregates) and power the TrueCoverage Dashboard and event-level insights.
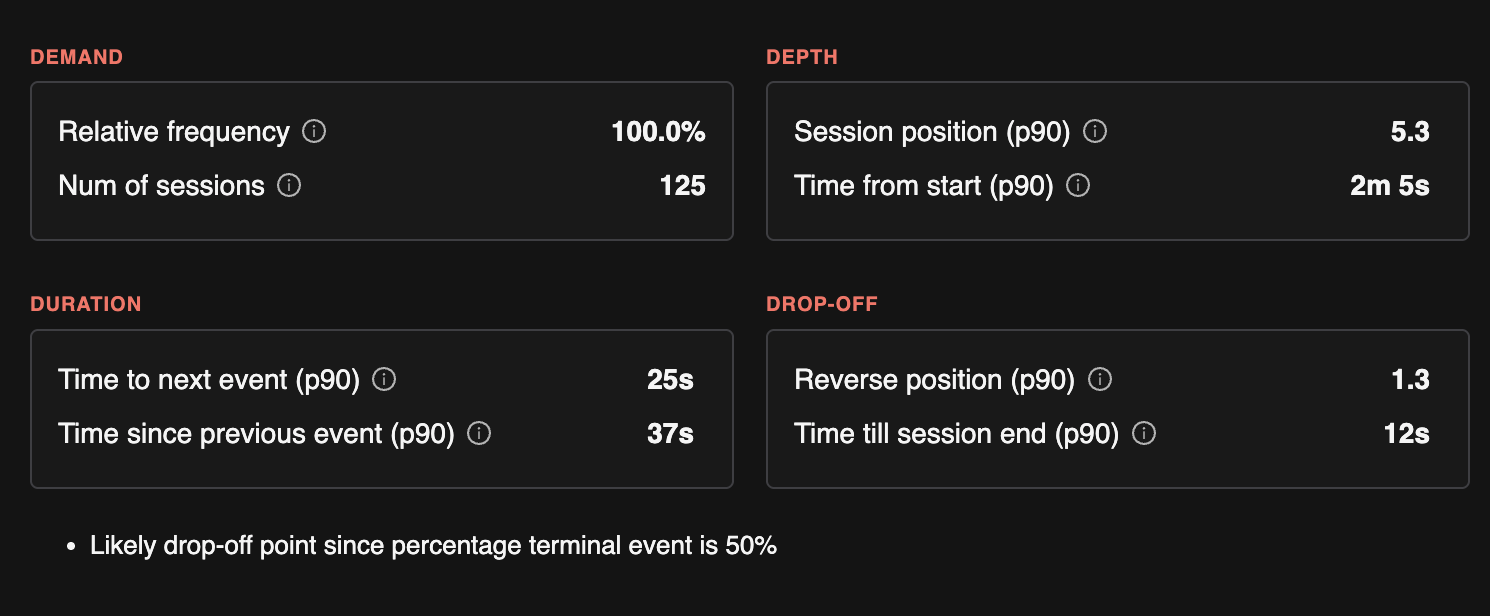
Stats we track per category
| 4D | Stats we track |
|---|---|
| Demand | Relative frequency (share of all event emits); number of occurrences; number of unique sessions that emitted this event. |
| Duration | Time to next event (histogram: how long until the next action); time since previous event; time from session start to first occurrence; time from event to end of session. Used for dwell and where users spend time. |
| Drop-off | Percentage of sessions where this event is the terminal event; reverse index in session (index from end—e.g. often last or near-last); time from this event to end of session. |
| Depth | Position in session (histogram: 1st, 2nd, 3rd event, etc.); reverse index; time to first occurrence in session (how long until users reach this action). Used for funnel ordering and discovery friction. |
Analytics Metrics We Calculate
All metrics below are computed per day (daily aggregates). They power the TrueCoverage Dashboard and event-level insights.
Session-Level (per day)
| Metric | Description |
|---|---|
| Number of sessions | Count of sessions in the selected base scope. |
| Session duration | Histogram of session length (e.g. time from first to last event). |
| Event count per session | Histogram of how many events each session contains. |
These help you understand session length and activity distribution before drilling into specific events.
Event-Type Level (per day)
For each event type (e.g. checkout, add-to-cart), we compute the stats listed in the 4Ds table above. In more detail:
| Metric | Description | 4D |
|---|---|---|
| Number of occurrences | Total times this event was emitted. | Demand |
| Number of unique sessions | Sessions that emitted this event at least once. | Demand |
| Relative frequency | This event's share of all event emits in the scope. | Demand |
| Position in session | Histogram of the event’s index in the session (1st, 2nd, 3rd event, etc.). | Depth |
| Reverse index in session | Histogram of “index from end of session”—often last or near-last suggests drop-off. | Drop-off, Depth |
| Time to first occurrence in session | Histogram of time from session start to the first emit—indicates how deep/friction to reach this action. | Depth |
| Time from event to end of session | Histogram of time from this event to session end—indicates drop-off after the action. | Drop-off, Duration |
| Percentage of sessions where this event is terminal | Share of sessions that ended on this event. | Drop-off |
| Time to next event in session | Histogram of time from this event to the next event—indicates dwell (Duration). | Duration |
| Time since previous event | Histogram of time from the previous event to this one. | Duration |
These metrics drive the event chips (relative frequency, position), and the dwell / drop-off / discovery indicators on the Overview and Event pages.
Event Transitions (per day, aggregated)
We record event transitions: when event B occurs after event A in the same session (A → B). For each transition we maintain:
| Metric | Description |
|---|---|
| Time to transition | Histogram of time from event A to event B. |
| Number of occurrences | How often this transition happened. |
| Number of unique sessions | Sessions that contained this transition. |
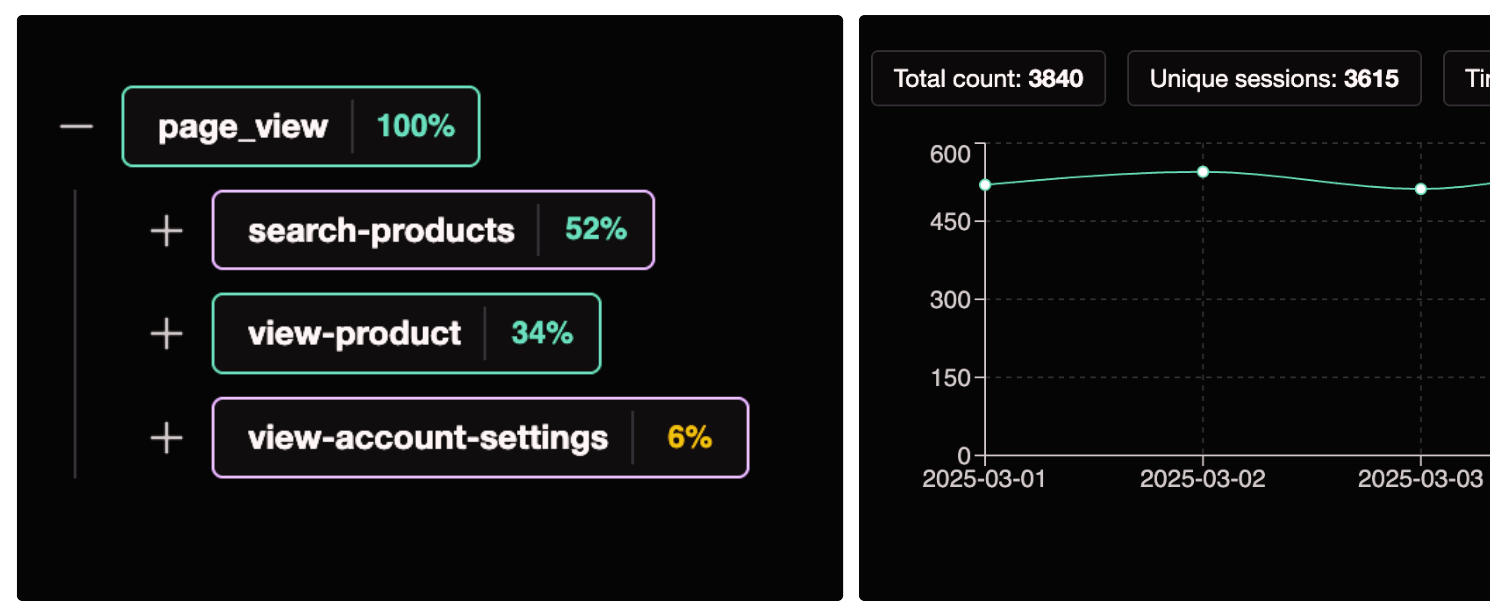
Transitions are used to show funnel next steps for a given event: what users do after doing X, and the distribution of follow-up actions (e.g. after add-to-cart, how often do they go to checkout vs remove-item).
Metadata Fields
You can attach metadata to events (e.g. form_of_payment, checkout_step, plan_type). TrueCoverage uses metadata to:
- Break down event counts by metadata key values (e.g. for
payment, break down byform_of_payment: card, PayPal, etc.). - Show which value combinations are covered in the coverage execution scope and which are not—so you can prioritize testing for high-frequency variants that lack coverage.
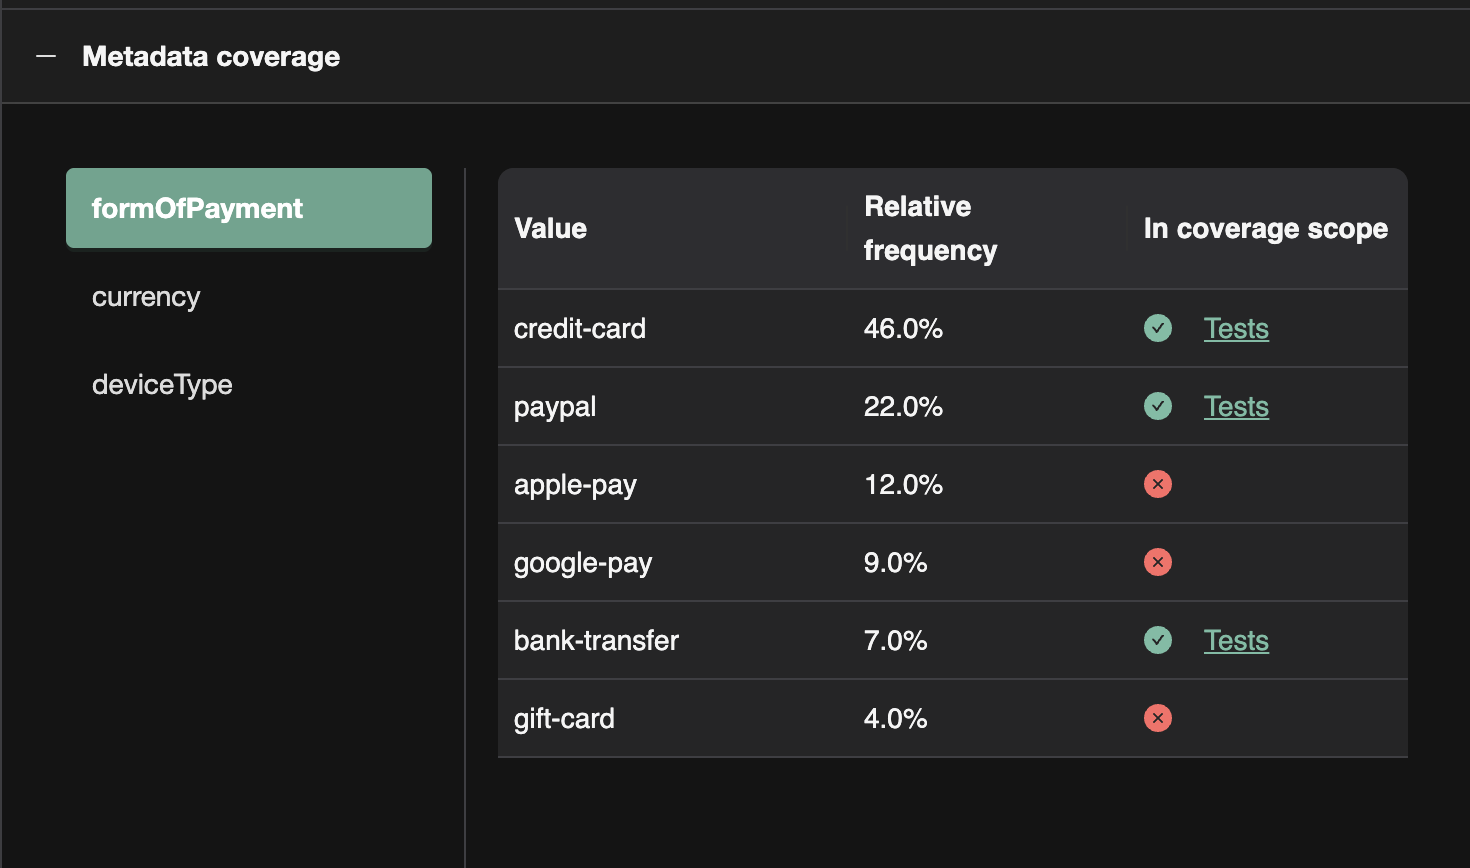
Good Usage of Metadata for Slicing
- Categorical dimensions:
form_of_payment,plan_type,checkout_step—slicing reveals which variants are common and which need test coverage. - Feature flags or segments: e.g.
experiment_variant,user_tier—to see behaviour and coverage by segment. - Outcome or context: e.g.
success/failure,source(modal vs inline)—to prioritize testing on failure paths or specific entry points.
Avoid using metadata for high-cardinality or unique values (e.g. user id, session id); use it for dimensions you want to slice and prioritize by.
Next Steps
- Instrumenting your app — SDK install and Playwright / Mobilewright wiring per platform.
- Dashboard — How the Overview and Event pages use these metrics, and how to use base vs coverage execution scope.
FAQ
What is base vs coverage scope?
Base shows real user behaviour; coverage shows which of those events and transitions your SmartTest executions emit.
Can I slice by metadata?
Yes—metadata keys like payment method or checkout step reveal high-frequency variants lacking tests.
How do sessions relate to tests?
Test runs produce session-like event sequences tagged with test identity so they align to production funnels.