Bugs
How TestChimp Catches Bugs
Bugs are caught when you run explorations. During explorations, ExploreChimp analyzes the following sources:
- DOM: Structure, content, and relationships
- Screen: Visual appearance and layout (screenshots)
- Network activity: API calls, responses, and errors
- Console logs: JavaScript errors and warnings
- Browser metrics: Performance, memory, and other metrics
- Comparison with approved baseline screenshots: Visual regression detection
Analyzing Various Data Sources
ExploreChimp performs comprehensive analysis across multiple data sources to identify bugs:
DOM Analysis
- Broken links
- Missing elements
- Incorrect structure
- Accessibility issues
Screenshot Analysis
- Visual glitches
- Layout inconsistencies
- Missing images
- Visual regressions
Network Activity
- Failed API calls
- Slow responses
- Error responses
- Security issues
Console Logs
- JavaScript errors
- Warnings
- Deprecation notices
Browser Metrics
- Performance issues
- Memory leaks
- Resource loading problems
Tagging Bugs at Screen-State Level
Bugs are tagged at the specific screen-state where they were identified:
- Provides precise context about where issues occur
- Makes it easy to understand and fix bugs
- Enables filtering and grouping by screen-state
- All bugs are viewable in the Atlas SiteMap
Types of Bugs Caught
ExploreChimp identifies various types of bugs:
UX Issues
- Layout inconsistencies
- Visibility issues
- Common UX violations
- Broken links
- Dead clicks
Performance Issues
- API response times
- Screen load times
- Cache configuration issues
Security Vulnerabilities
- Missing security headers
- Cache configuration issues
Visual Regressions
- By comparing with baseline images
Responsiveness
- How the screen adapts to different viewports
Accessibility
- Missing alt-texts
- Missing labels, placeholder texts
- Missing tab-indexes
Usability
- Understandability of UI
- Confusing flows
And more...
Viewing Where Bugs Occur
In SiteMap
Bugs are displayed in the Atlas SiteMap:
- Tagged to the screen-state where they were identified
- Grouped by screen for easy navigation
- Filterable by bug type, severity, and status
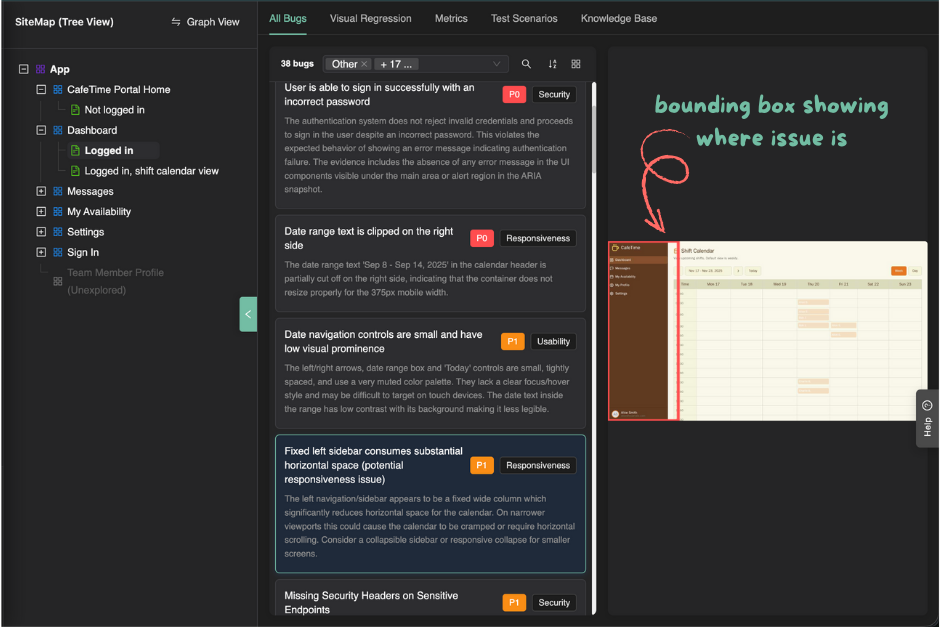
Using the Artifact Viewer
- Click on a bug to open the artifact viewer
- The artifact viewer displays the artifact that was used for identifying the bug
- The exact location of the issue is highlighted based on the bug source:
- Screenshot-based bugs: A bounding box on the screenshot shows where the issue occurs
- Performance issues: The specific metric is highlighted
- DOM issues: The relevant DOM node is highlighted
- Network issues: The relevant API call or response is highlighted
- And similarly for other bug sources
Auto-Assigning Bugs to Team Members
Setting Up Auto-Assignment
- Navigate to a screen in the Atlas SiteMap
- Open the Collaboration tab
- Set a Primary Owner for the screen
- Bugs identified for that screen will be automatically assigned to the primary owner
Benefits
- Bugs are routed to the right person immediately
- Reduces manual triage effort
- Ensures accountability
- Speeds up bug resolution
Bugs are a critical part of TestChimp's value proposition, helping you identify and fix issues before they impact users.
One-Click Bug Fixing with OpenHands
TestChimp integrates with OpenHands to enable automated bug fixing. Once configured, you can trigger cloud agents to automatically fix bugs with a single click, with fixes delivered as pull requests.
Rich Context for Precise Fixes: When you trigger a bug fix, TestChimp provides the cloud agent with all the context it has about the bug, including:
- Screenshots with bounding boxes: Visual indicators showing exactly where the bug occurs on the screen
- API payloads: Relevant network requests and responses that triggered or are related to the bug
- Console logs: JavaScript errors, warnings, and other console output captured when the bug was identified
- DOM context: Element selectors and structure information
- Screen-state information: The specific screen and state where the bug occurs
- Artifact references: All captured artifacts that provide context about the bug
This comprehensive context enables the cloud agent to make precise, targeted fixes rather than generic solutions.
For setup and configuration details, see the OpenHands Integration documentation.
For exporting bugs to Jira or as CSV, see the Bugs List Viewer section in the Jira Integration documentation.