14 posts tagged with "Agents"

Special purpose AI tools that augment manual testing

View All Tags

Verified Tests: When Agents Write the Coverage, Trust—but Verify

· 6 min read
Nuwan Samarasekera
Founder & CEO, TestChimp

TL;DR: Agents built the product. Agents authored the tests that verify the implementation. The missing piece is accountability—has anyone actually looked at the test to ensure it truly verifies the scenario? Verified Tests puts that sanity check in the platform: inspect screen captures, steps, and code, then stamp a Verified Badge on the covering scenario.

Full product guide: Verified Tests.


The missing piece is accountability

Agents are very good at getting a path green.

The SmartTest runs. The scenario is linked. Requirement coverage looks healthier than last sprint.

That is not the same as: this test actually verifies the behaviour the scenario describes.

Has anyone actually looked at the test?

A scenario annotation is cheap to add—and agents add them at speed. They can link the right scenario to a script that asserts a toast, skips the important check, or walks a cousin flow that happens to share a button. The dashboard still counts it as coverage.

We used to paper over that with implicit knowledge: the person who wrote the test was the person who knew what it proved. Agents broke that assumption. Volume went up. Inspection did not.

Failure modeWhat goes wrong
Linked ≠ provenThe test is tagged to a scenario but never asserts the expected outcome
Happy-path impersonationA green run for a neighbour flow masquerades as coverage of the hard one
Unowned claimsCoverage reports “covered”; nobody can say who looked at the script

Green is an execution fact. Linked is a mapping. Verified is the accountability layer: a person has sanity-checked that the covering test truly verifies the scenario.

That is the problem Verified Tests solves.


Why this is necessary in the agentic era

Before agents, test authoring was slow enough that “who wrote this?” was a reasonable proxy for “who checked this?”

That proxy is dead.

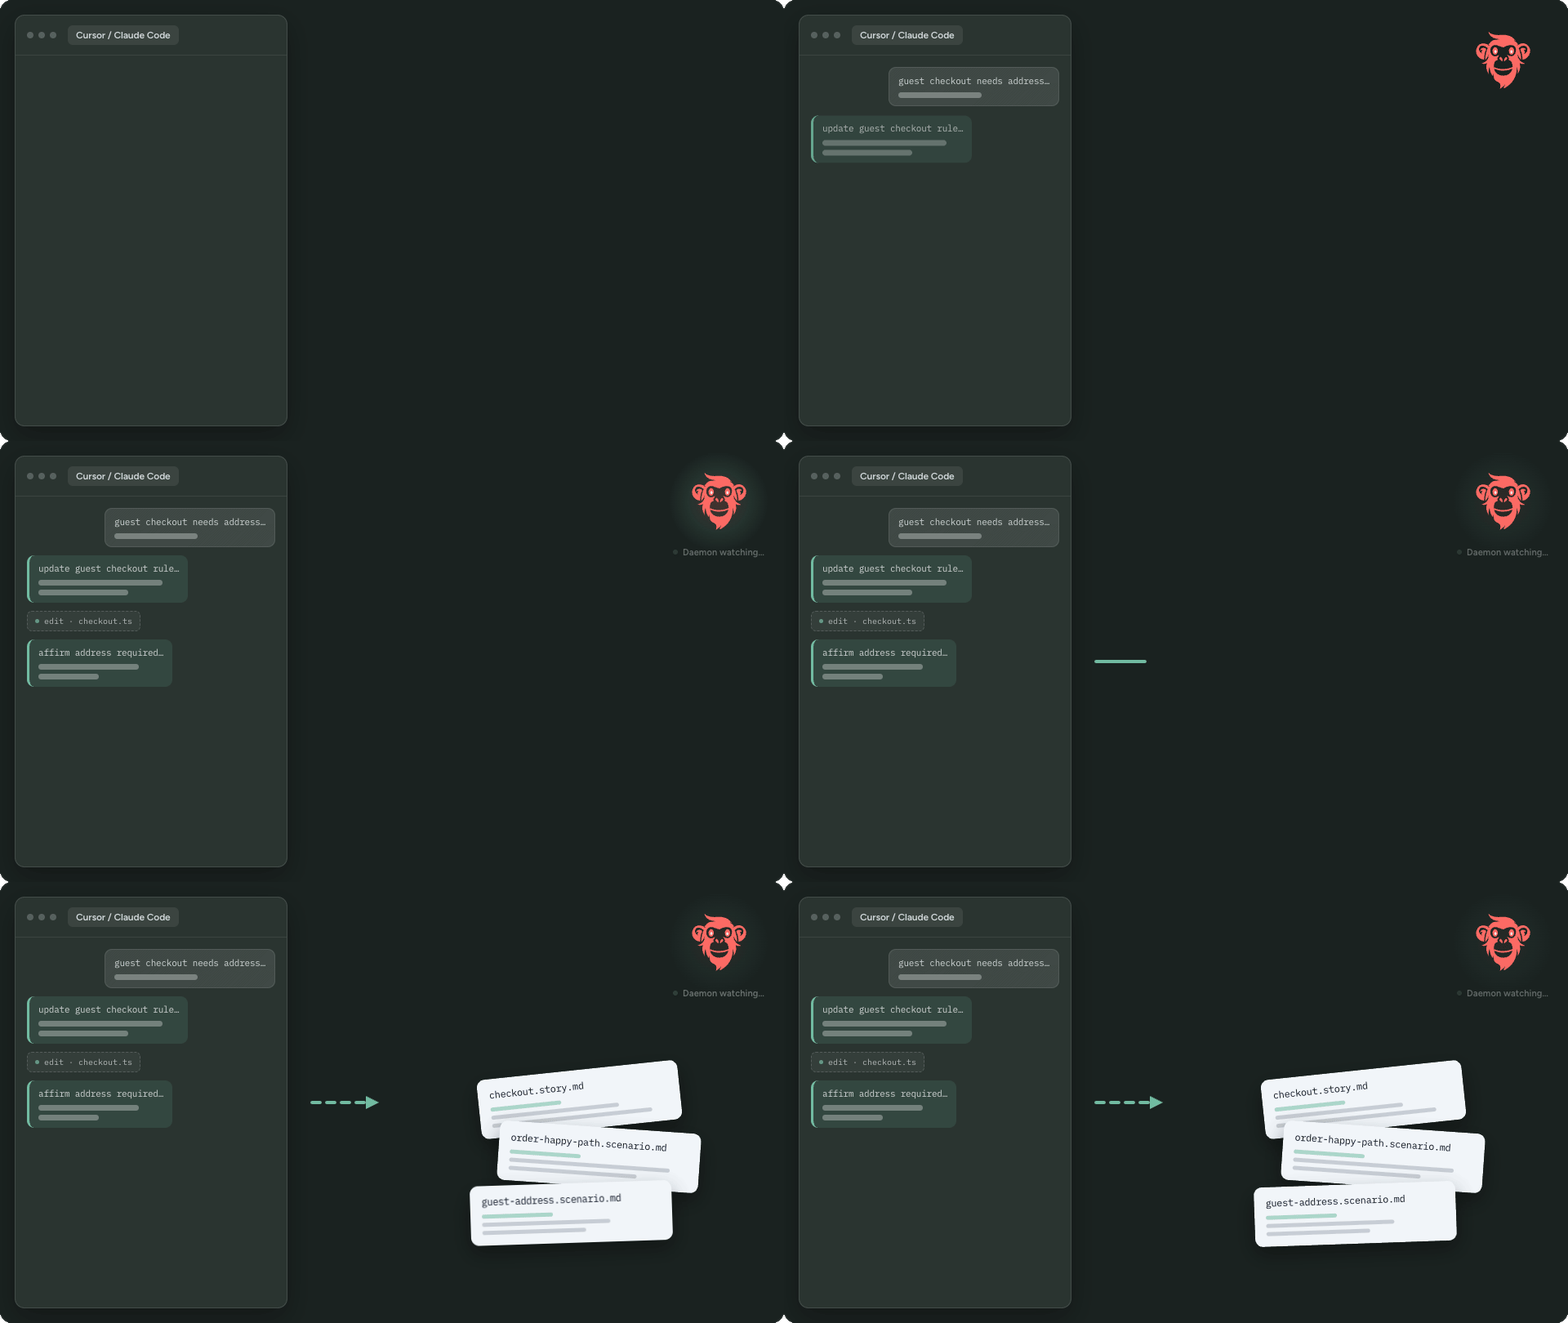
Agents implement. Agents author SmartTests. Agents attach scenario ids because the plan files told them to. You still need a durable record that a person opened the execution, looked at what actually happened, read the script, and agreed: yes, this test verifies that scenario.

Otherwise requirement traceability is a spreadsheet of claims with nicer UI. Coverage insights tell you what ran. They do not tell you whether the test is the right test.


Introducing Verified Tests

TestChimp now lets you Verify tests in the platform—without bouncing out to a repo or a recording elsewhere.

Open a SmartTest execution and you already have what you need to make an informed decision:

  • Screen captures from the run
  • Steps the test actually took
  • The code, via View Test, so you can read the script next to the evidence

Then use the check badge next to the SmartTest name. Same visual language as a verify badge elsewhere on the internet, because the job is the same: this was inspected.

Three states on the test:

  • Hollow — none of the linked scenarios are verified
  • Grey — some, not all
  • Blue — every linked scenario for that test is verified

For one scenario, you confirm. For several, you verify per scenario—or Mark all as verified. Hover a filled badge and you see who verified it.

Un-verify is deliberate: it records manually unverified, not “never happened.” The audit trail stays.

Status lives in TestChimp, not in source. Agents can keep authoring Playwright. Humans stamp the claim when they have actually looked.


A Verified Badge on scenario coverage

Plans, requirement coverage, and test runs already show recent execution results per scenario.

You now also see a Verified Badge on each scenario—an extra layer of assurance that the product is being tested properly, not only that something ran green.

  • Filled — a user has sanity-checked a covering test for that scenario
  • Hollow — the scenario has tests, but nobody has inspected them yet
  • Omitted — no linked tests, so there is nothing to verify

Clicking the coverage-side badge does not flip the bit. It tells you how: open an execution, inspect the run, then use the check badge next to the test name. Verification is an inspection action, not a bulk paint on a dashboard.

That is the point. If it were too easy, we would have rebuilt the original lie at a larger scale.


How this fits the rest of TestChimp

If you’ve been following along:

Planned reality → linked automation → inspected coverage → release confidence. The middle of that chain was the hole once agents started writing both sides.


Frequently asked questions

What is a verified test?

A verified test in TestChimp is a SmartTest a project member has inspected and confirmed actually covers a linked scenario. It is more than a green run or a scenario annotation: someone looked at the screen captures, steps, and code, and stamped the claim.

How is verified different from linking a test to a scenario?

Linking (a Playwright annotation with type: 'scenario' and #TS-<n>) is a coverage claim. Verification is a human sanity check of that claim. You can have linked, green, and still unverified.

Where do I verify a SmartTest?

Open a SmartTest execution (click a coverage square). Inspect the screen captures, steps, and test code, then use the check badge after the test name. Coverage-train badges are read-only hints.

What does the Verified Badge on a scenario mean?

A filled badge means at least one covering SmartTest has been manually verified for that scenario. Hollow means tests exist but have not been sanity-checked yet. No linked tests → no badge.

Does renaming a scenario reset verification?

No, as long as the scenario ordinal (#TS-n) stays the same. Linking a different scenario is a new claim and starts unverified.

Can I un-verify?

Yes. Confirming un-verify sets the link to manually unverified (distinct from never verified). Who/when hover applies to the verified state.

What if the test has no linked scenarios?

It cannot be marked verified. There is no scenario claim to inspect. Link the scenario first.


When agents run your SDLC, trust—but verify.

Docs: Verified Tests · Link tests to scenarios · Requirement traceability.

Performance Testing for Agentic Teams: Journeys, Composites, and Comparable Runs

· 7 min read
Nuwan Samarasekera
Founder & CEO, TestChimp

Agent coding is very good at getting the feature to work.

A user can check out. The API returns 200. The SmartTest is green. You merge.

Then ten concurrent checkouts queue behind one chatty query. Or the reports page, which was snappy with three invoices in the seed DB, falls over on a tenant that actually uses the product.

That gap is not a mystery. Agents optimize for the path in front of them—one user, empty-ish data, mocked collaborators that return in 0 ms. Concurrency and data volume are different questions. Functional tests do not answer them.

So we shipped performance testing as a first-class TestChimp surface: k6 in your repo, agentic workflows that author the right journeys (and keep composites honest), related runs after a PR or a release, and an Executions view that compares this run to a prior one.

Full product guide: Performance Testing.


The questions that actually matter

Not “did k6 print a chart.” The questions product and eng already have:

You want to knowWhat we run
Will this path hold if traffic shows up together?Load journeys (many VUs)—not a bigger dataset
Does this page still work when the tenant already has history?Volume journeys (cardinality / records)—not more users
Did this PR make checkout slower than last week?Related journeys, then compare to a matching prior run
Can the evening mix still breathe if we add this journey?A composite with an explicit membership/weight—absolute load stays a separate decision

We keep load and volume as separate axes. “Make it heavier” by turning both knobs hides which one broke.


Agents author journeys. You still own capacity.

/testchimp create-perf-tests does not invent a k6 file from vibes.

It ranks real scenarios (priority, semantic coverage, get-requirement-coverage --include-perf). It uses redacted REAL E2E interaction shapes—method, path template, schema, status class, timing distribution—not cookies, tokens, or production bodies. When TrueCoverage is mature, relative demand helps order the queue and suggest composite weights.

What it will not do: copy a production RPS into load.js. TestChimp telemetry tells you what is worth testing. You (or run-perf-tests.policy.md) still set VUs, duration, and dataset size. Smoke is the default while authoring. Load/volume wait on an explicit capacity decision.

Composites are a weighted mix of journeys—“typical overall load,” not isolated degrade detection. Adding a journey to a composite is always a prompted approval. Silent membership is how you accidentally change the mix and then argue about the chart.

Outbound deps (payments, email, LLMs, partner APIs) get harness mocks with realistic latency. Hitting Stripe in a load test is expensive and flaky. Stubbing it at 0 ms is worse: you never see pool exhaustion. Either outcome is false confidence.

Folder layout, metadata, and wrappers: How performance tests are organized.


Perf load/volume does not execute inside /testchimp test. Functional smoke should stay fast. k6 execution is /testchimp run-perf-tests or CI k6/scripts/run.sh. Run QA does write plans/smart-smoke/<branch>/related-perf-tests.json when k6/journeys exists, so the next CI --impacted run picks up the affected journeys.

On a PR, we select related journeys from the change set—scenarios, operations, path templates—then run them through k6/scripts/run.sh --impacted. Bare k6 run is not a TestChimp run: no ingest, no Executions charts.

On a release, the prompt from the release page is:

/testchimp run performance tests for release 1.2.0

The git range is prior SHA → cut SHA, not whatever happens to be checked out. Ingest stamps TESTCHIMP_RELEASE so the release panel and Executions list light up. If existing journeys do not cover that range, the agent asks whether to author (nested create-perf-tests on the same range) instead of silently inventing a suite or pretending coverage exists.

/testchimp upkeep-perf is the long loop: stale scenario links, drifted contracts, composite membership, thresholds that should not be quietly weakened to make compare green.

/testchimp init-perf scaffolds k6/ once. /testchimp import-perf-tests brings Locust/JMeter/Gatling/Artillery/k6-from-elsewhere into that tree. Source VU counts stay out of load profiles until you approve capacity.

Workflow walkthrough: Performance testing workflows.


Results you can overlay, not a one-off HTML report

Wrapper runs ingest a summary and attach downsampled timeseries (p95, fail rate, VUs, and the rest of the k6 dump). Executions → Performance Tests lists them—optionally grouped by batch. Open a run for threshold, p95, fail rate, duration, metric-over-time, and VUs.

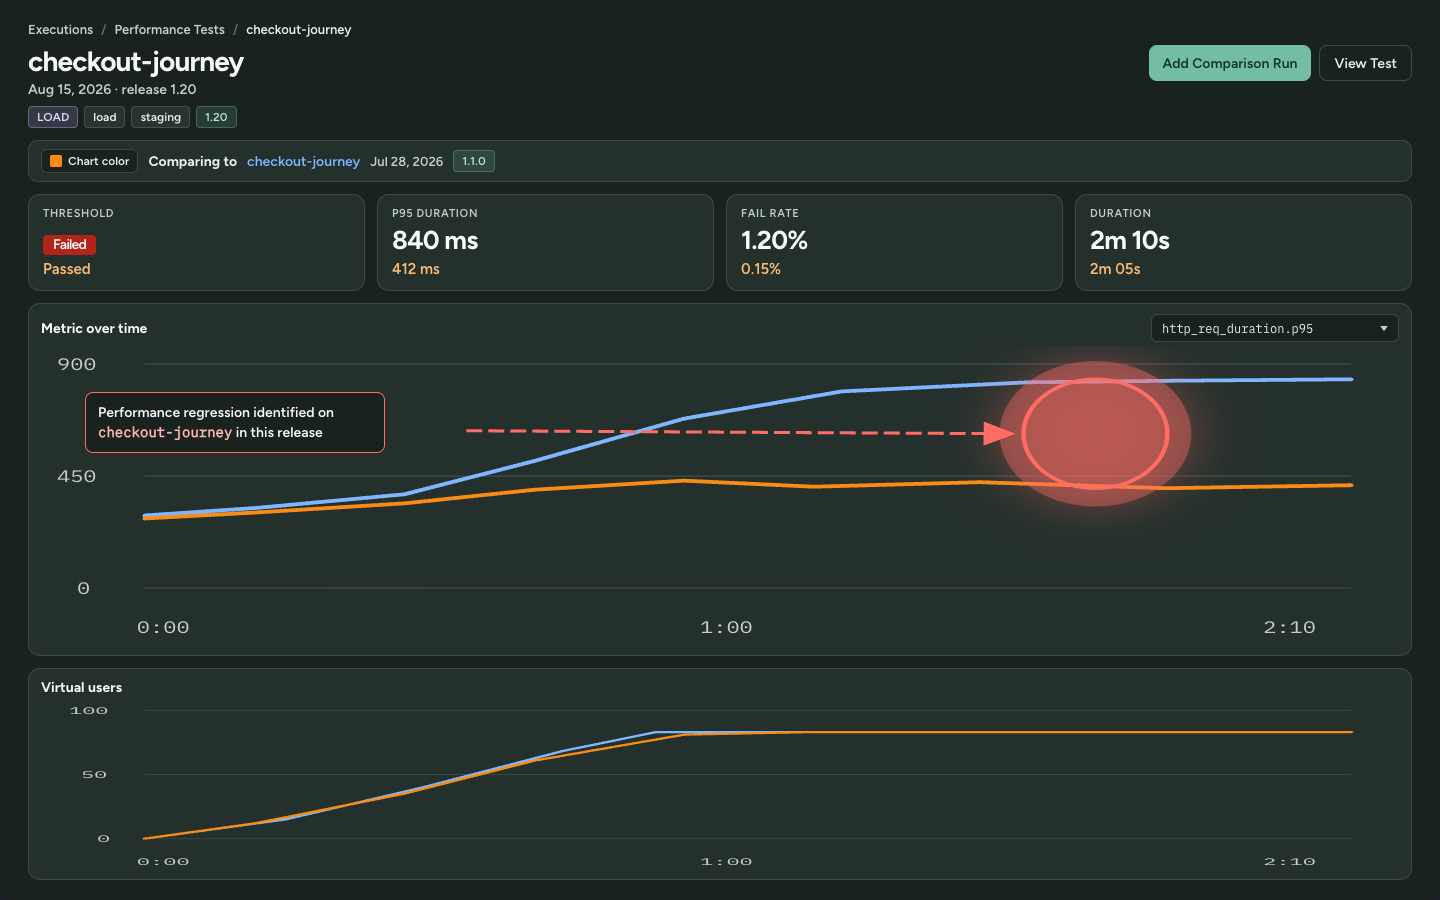
Performance regression on checkout-journey: overlay the prior release and the p95 gap is obvious

Then click Add Comparison Run. Recommended candidates share the comparison keys (environment, profile, dataset, LLM mode, mock/latency profile). The overlay re-bases both series on elapsed time so you are not comparing Tuesday 4pm wall clock to Wednesday 9am.

That is the degrade question: same kind of run, previous comparable result, is this worse? Green against a loose threshold can still be a regression versus last Tuesday. CLI compare-perf-to-baseline is the same contract for agents and CI—it exits nonzero when comparison.regressed is true. A mismatched baseline is incomparable, not a pass.

Viewing results.


How this fits the rest of TestChimp

If you’ve been following along:

  • SmartTests (now grouped as Functional Testing in the docs) prove the path works for a user
  • Smart Smoke keeps that suite runnable in a CI budget
  • TrueCoverage says which journeys real people actually take
  • Performance testing asks whether those journeys still hold when many people take them—or when the tenant already has history

Planned reality → functionally tested reality → load/volume-tested reality → production reality. The middle was the hole for teams whose agents ship faster than anyone can stare at an EXPLAIN plan.


Frequently asked questions

What is TestChimp performance testing?

Grafana k6 scripts in your mapped tests folder (k6/journeys and k6/composites), authored and selected by agentic workflows, ingested into Executions so you can chart a run and overlay a comparable prior run.

Do I need this if my SmartTests are green?

Yes if you care about concurrency or tenant data volume. Agents (and humans) routinely ship designs that are correct for one user on a small seed database and fail under the conditions production actually creates.

Does /testchimp test run k6?

No. Keep functional PR smoke fast. Use /testchimp run-perf-tests (or a dedicated CI job that calls the same wrappers).

Will TestChimp pick my VU count from production traffic?

No. TrueCoverage and interaction timings are relative signals—what to test, how to weight a mix. Absolute VUs, RPS, duration, and dataset size come from policy or an explicit approval.

How do I see if we got slower?

Open the run → Add Comparison Run → pick a recommended candidate. Or compare-perf-to-baseline in CI. Compare only matching environment / profile / dataset / mock profile.

Docs: Intro · Organization · Workflows · Results.

Concept: What is load testing? · Volume testing · k6 vs JMeter vs Locust · Compare across releases.

Smart Smoke: Max Semantic Coverage Within Your CI Time Budget

· 3 min read
Nuwan Samarasekera
Founder & CEO, TestChimp

Your agents have been writing tests for a few months, and now you have 500+ E2E tests taking an eternity to run. Sounds familiar?

Say hello to Smart Smoke.

With agents authoring tests en masse, the problem has changed. Coverage gaps close fast—but:

  • Your CI bill keeps growing as you run the full suite on every PR
  • Worse, you wait hours before knowing if anything broke

Today, smoke suites are often manually managed. Tag lists. Folder filters. A @smoke set someone curated last quarter. That leaves a lot of useful signals on the table—especially as test suites grow at an unprecedented pace.

What really interested me here—as a lover of algorithms—was that this is essentially a classic optimization problem:

Given N minutes, how do you maximize semantic coverage + PR impact?


First: find what the PR can break

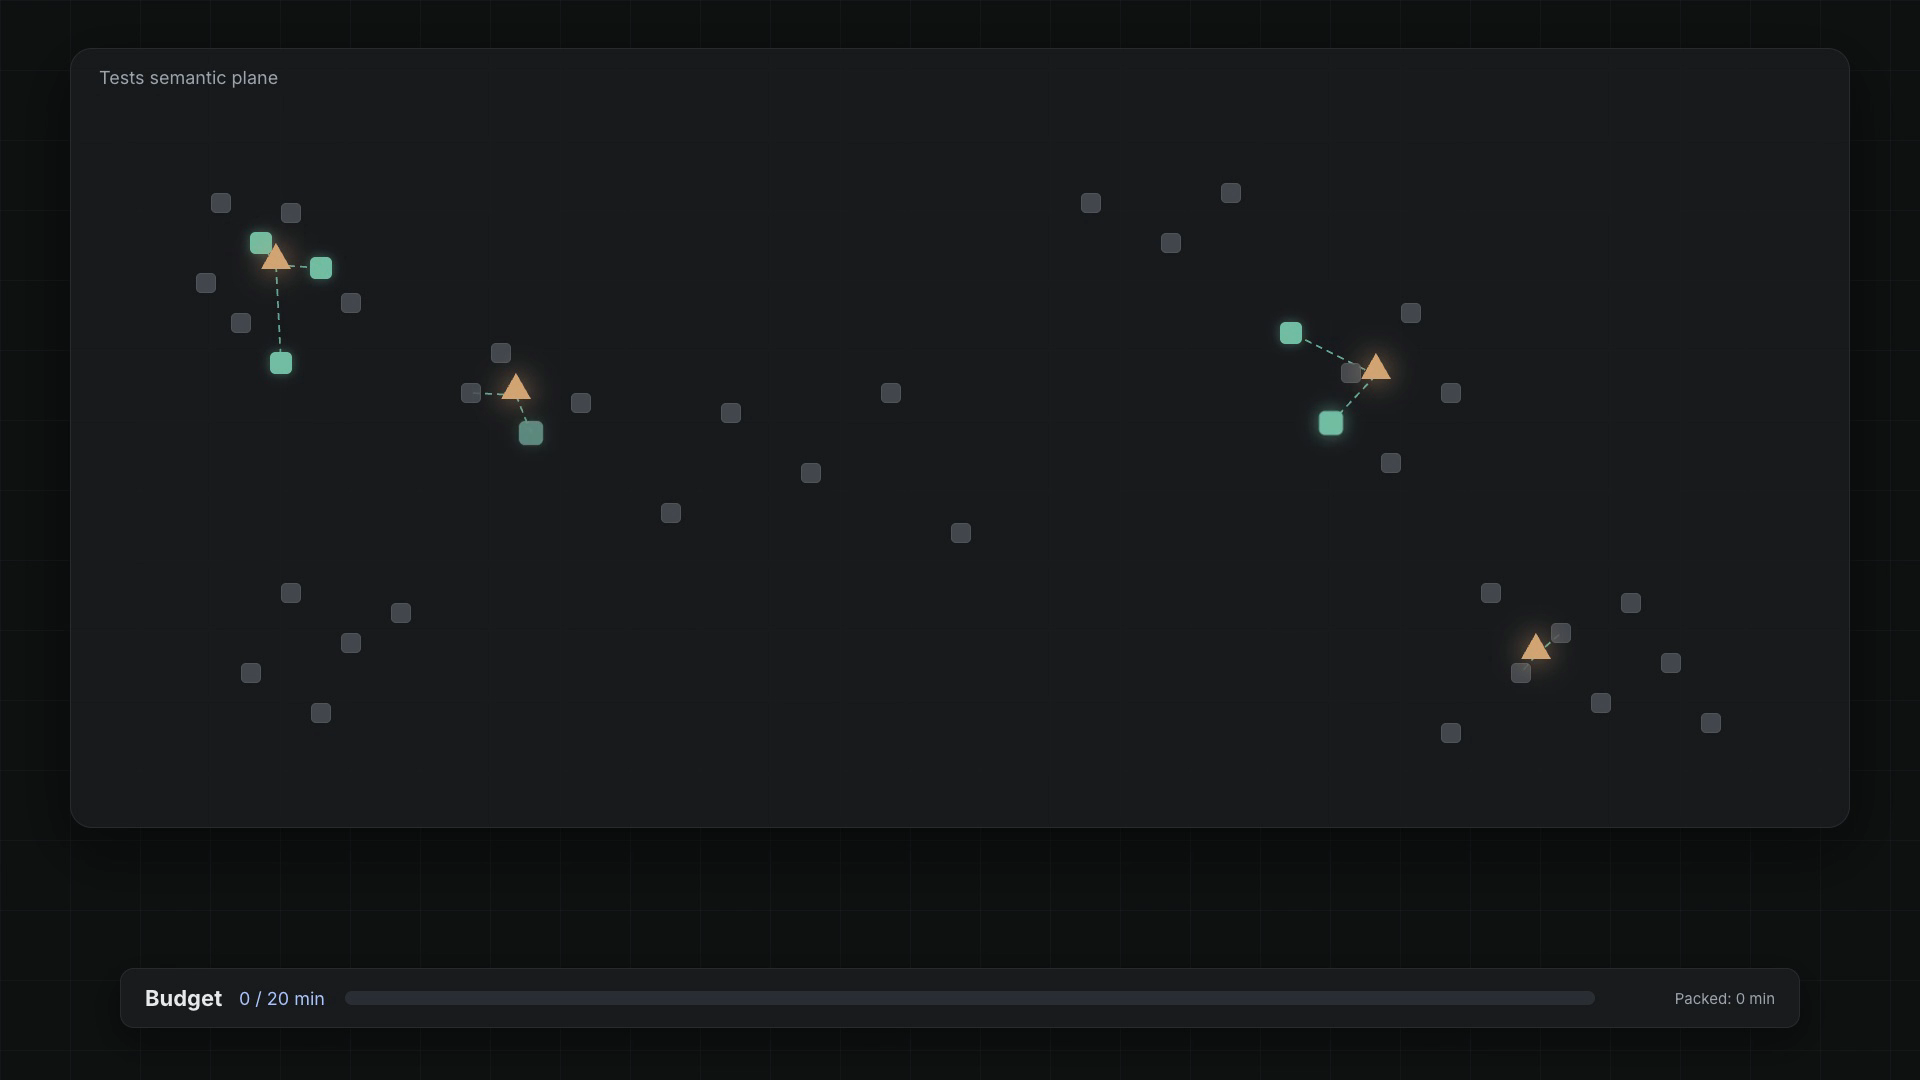
An agent identifies the tests relevant to the change—impacted scenarios from your plans, linked SmartTests via scenario annotations, plus anything newly authored on the branch. That related set lands in plans/smart-smoke/<branch>/related-tests.json.

Related tests on the semantic plane

That’s the seed. Then comes the fun part: covering as much ground as possible.


Paint the canvas within a fixed budget

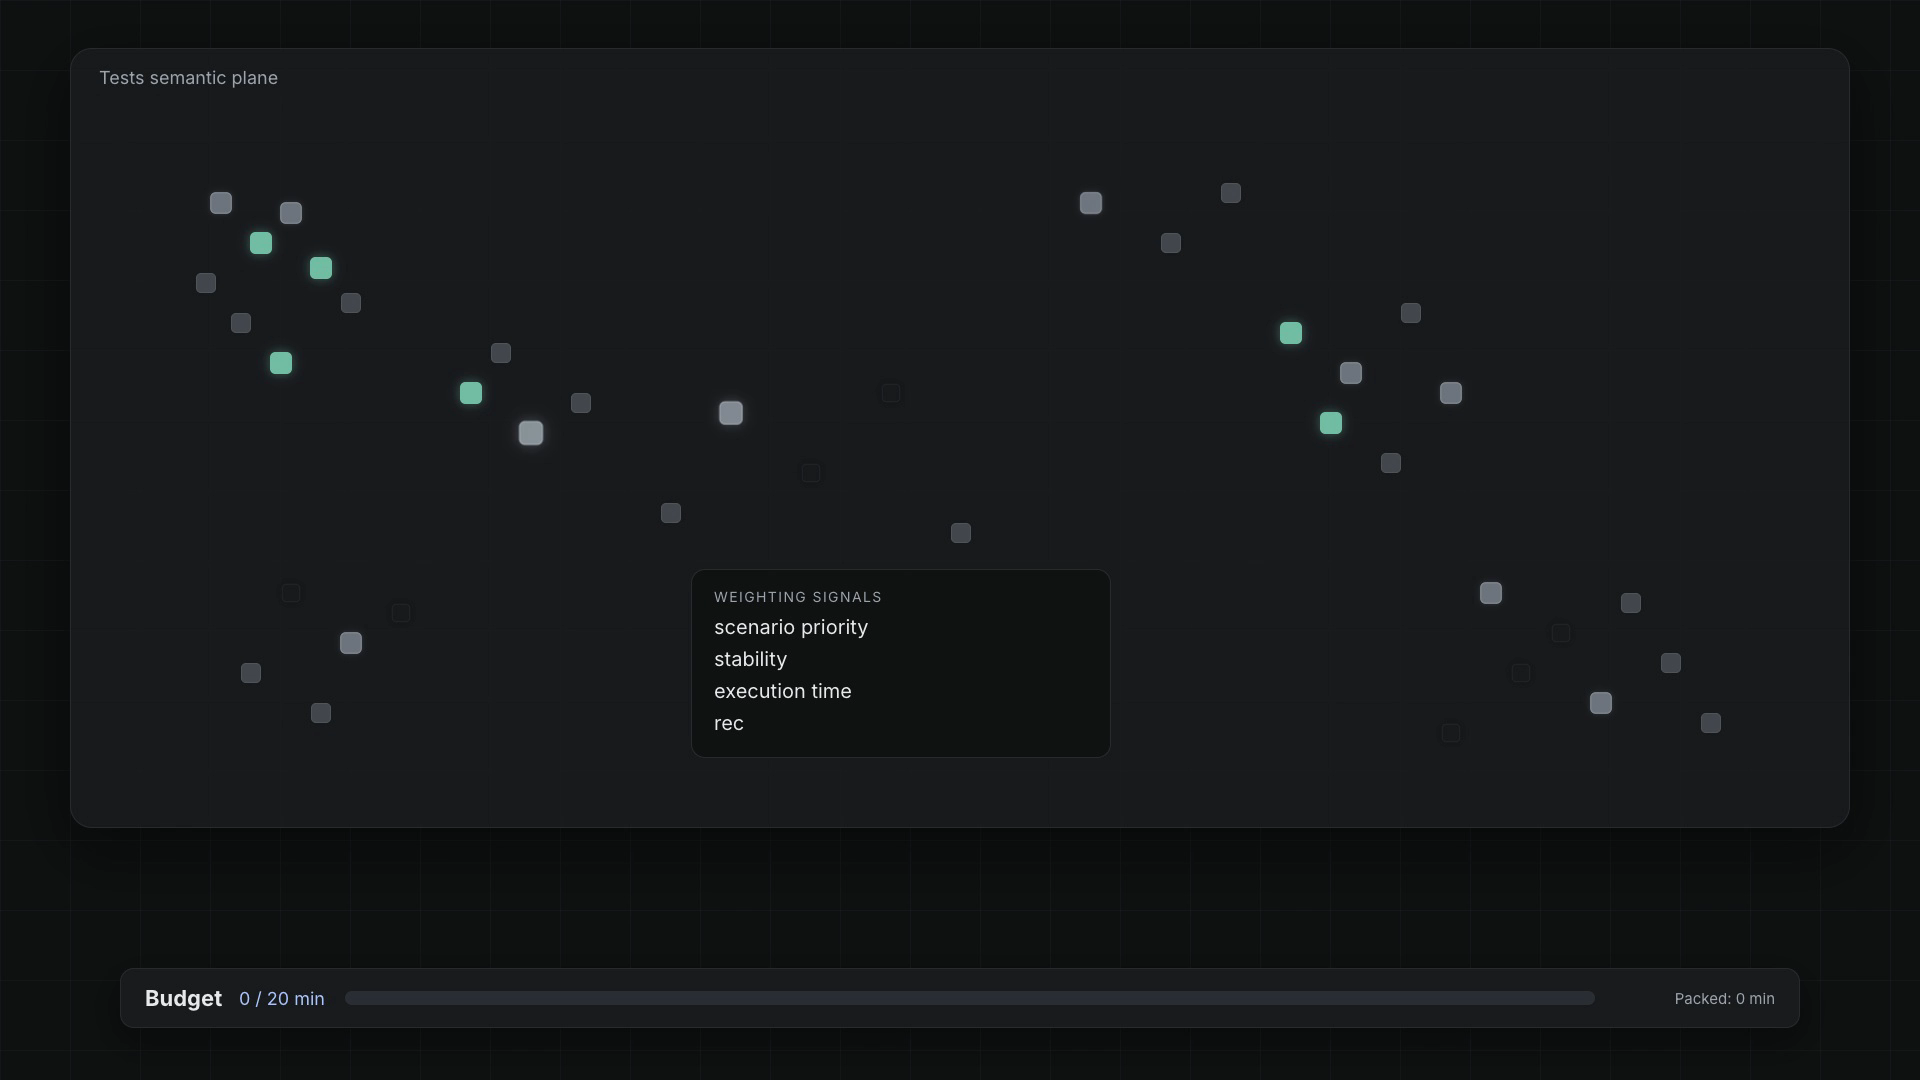
Imagine your tests laid out as nodes on a semantic canvas. The problem becomes:

Paint the canvas by selecting test nodes to maximize the covered spread—within a fixed time budget.

Pack max semantic coverage into the budget

We don’t just grab the nearest cluster. We iteratively pick the next test that adds the most new ground—so selection spreads across the plane instead of camping in one corner.


Then weigh the terrain

Pure geometry isn’t enough. We weigh the terrain using signals like scenario priority, recency, test stability, execution time, historical failures—so packing prefers tests that are both informative and practical.

Weighting signals

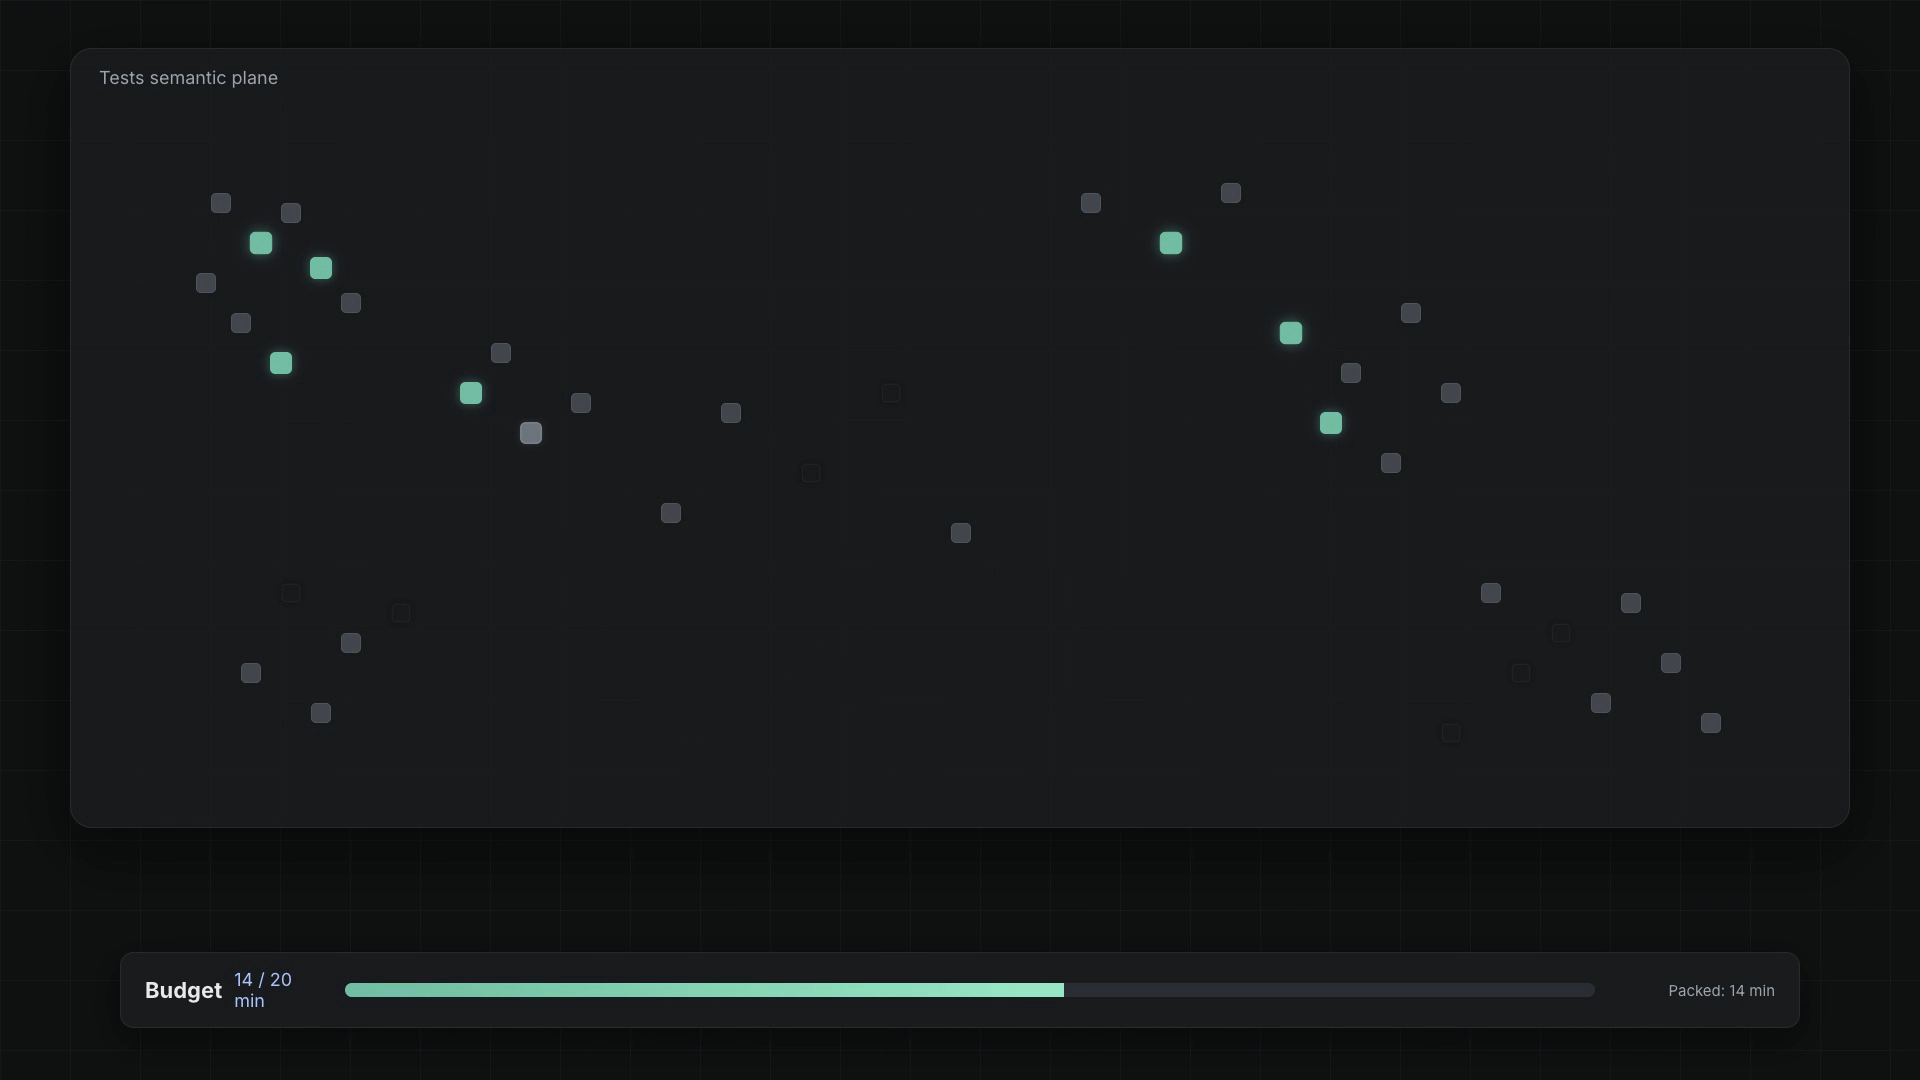
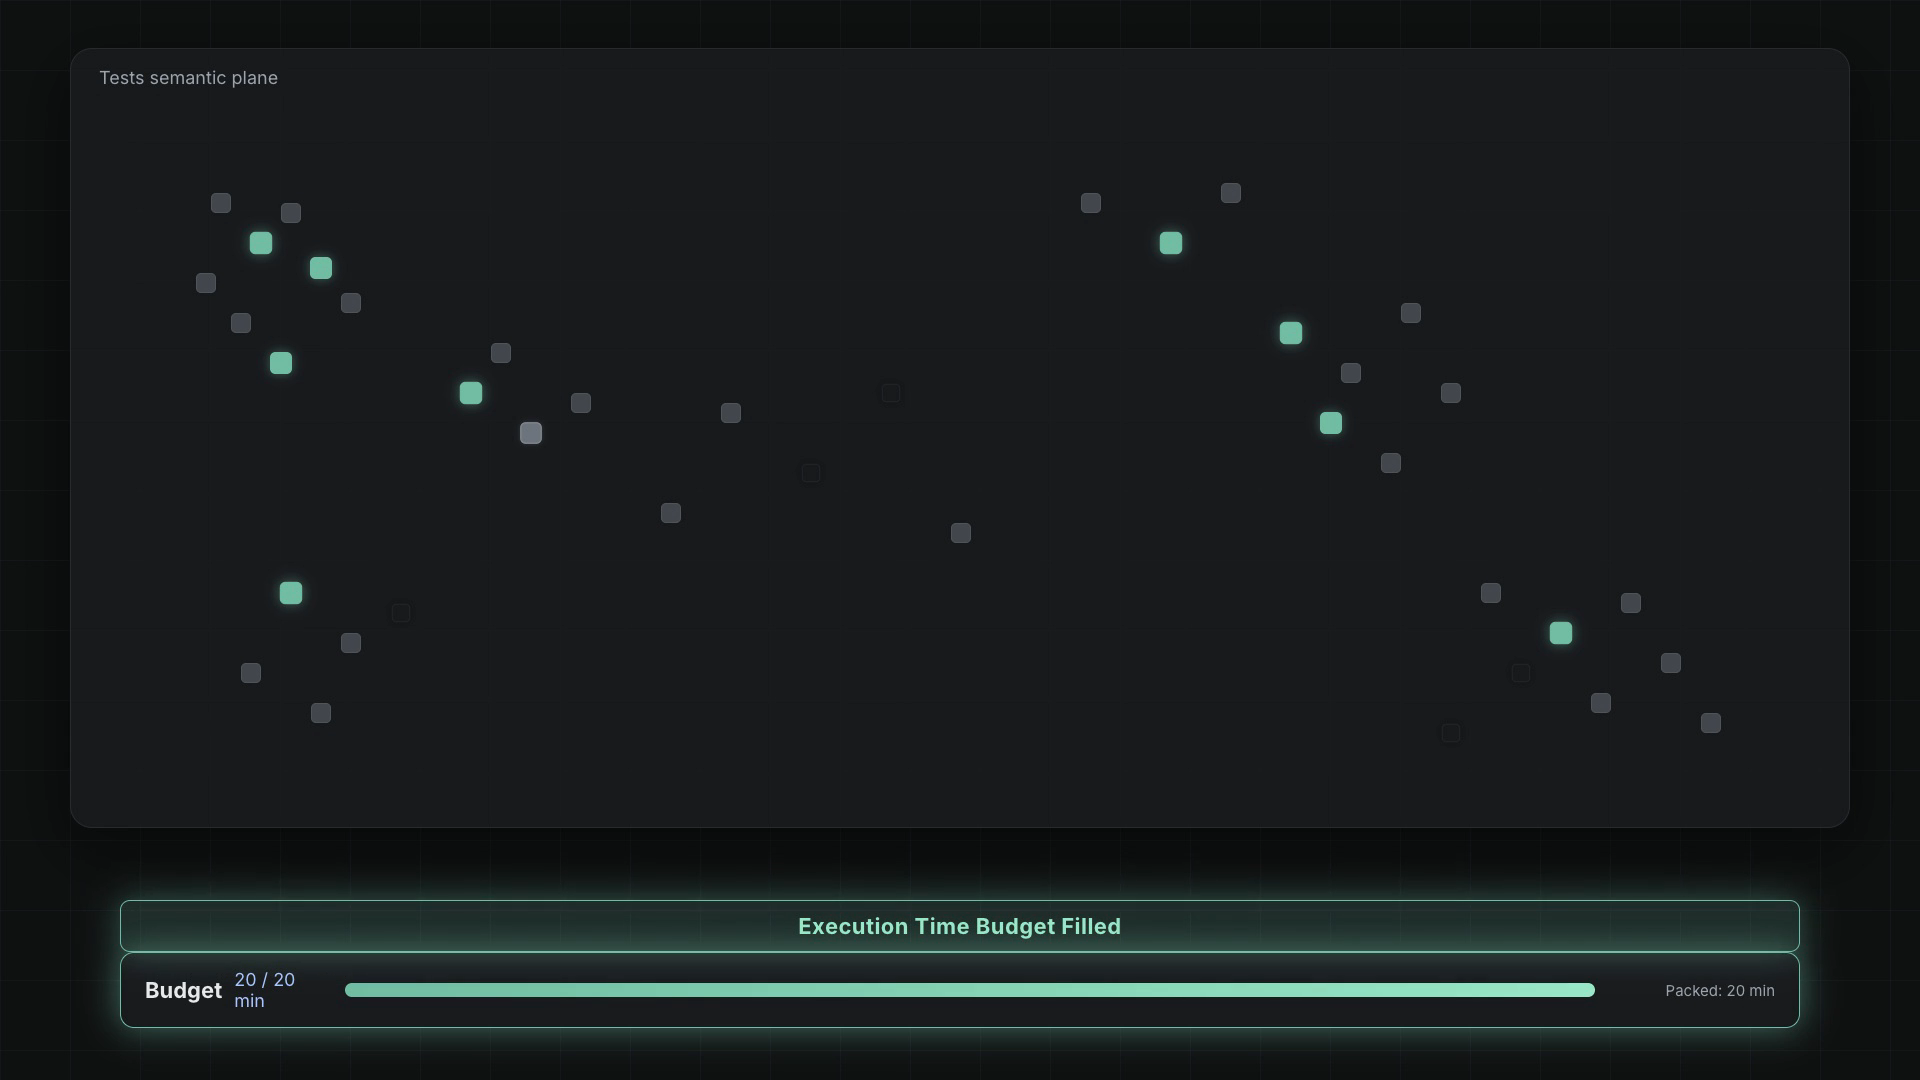
Seeds always include related tests, tagged smoke (e.g. @smoke), and newly authored branch tests. Packing fills whatever budget remains—until the bin is full.

Execution time budget filled

The result: the best subset of tests to run as smoke for a given PR—giving you the most confidence within a fixed time budget.

Less CI cost. Less waiting. More confidence.


Same Playwright command

Smart Smoke isn’t a new runner. You keep your SmartTests and the same npx playwright test—opt in per run:

export TESTCHIMP_SMART_SMOKE_ENABLED=true
# optional: time budget, suite %, tags, related-tests-only
npx playwright test

Non-selected tests skip with reason smart-smoke (distinct from an explicit test.skip).

ModeBest for
Related-tests-onlyTight PR confidence (safe agent default)
Budgeted smokeBroader ROI within a time / count / suite-% cap

It plugs into /testchimp test as Phase 5, or standalone via /testchimp run smart smoke.

Full reference: Smart Smoke Runs · How it works · Configuration.

Plugin: @testchimp/playwright (≥ 0.2.20).

Smoke responsibly.

Semantic Canvas: See Your QA Knowledge by Meaning

· 6 min read
Nuwan Samarasekera
Founder & CEO, TestChimp

TL;DR: Existing QA tooling lets you follow explicit links only—story → ticket → test case → run, if someone remembered to wire them. Anything related by meaning but not linked stays invisible. TestChimp consolidates stories, scenarios, SmartTests, issues, and TrueCoverage events into a single embedding space. Semantic Canvas (in QA Brain) projects that space onto a 2D map so you can navigate neighborhoods, identify clusters, and surface related entities by conceptual similarity—then link near-misses, mark lookalikes distinct, or raise cleanup work from the sidebar.

Semantic Canvas in QA Brain


Last week we shipped InfiniTrace—walk the structural edges of your QA graph board by board.

That answers:

“What is linked to this story / test / event?”

Most of the industry stops there. Jira, TestRail, CI folders, coverage tools: if the edge wasn’t created, the relationship doesn’t exist. Keyword search helps only when titles share tokens. Paraphrases, cross-type near-misses, and quiet duplicates fall through the cracks—especially when agents author plans and tests at speed.

The sibling question traditional tools never answer:

“What looks like this—even if nobody linked it yet?”

Or:

“Which entities belong to the same conceptual neighborhood?”

Those need meaning, not another list sorted by updated-at.

TestChimp already maps every QA entity into a shared embedding space—beyond explicit links, into semantic proximity. Semantic Canvas is the surface that lets you see and navigate that space, next to InfiniTrace in QA Brain.


Introducing Semantic Canvas

Semantic Canvas is a spatial map of your project’s QA knowledge—laid out by conceptual similarity.

Open QA BrainSemantic Canvas tab (/brain?tab=semantic-canvas).

  1. Add the entity types you care about—Stories, Scenarios, Tests, Issues, Events
  2. Nodes land on a UMAP canvas: high-dimensional embeddings projected so local neighborhoods reflect cosine similarity
  3. Pan, zoom, filter, search (#US-12, titles, …)
  4. Click a node → the detail sidebar fills with cosine-ranked peers
  5. Link, mark distinct, create a duplicate-cleanup issue, or open details—in place

Deep links encode types, filters, border modes, and selection in ?locator= (with tab=semantic-canvas). “Look at this cluster” is a URL, not a screenshot.

Docs: Semantic Canvas.


What you can actually do with it

A few use cases that show why a meaning map beats link-chasing alone:

Plan neighborhoods with live automation health

Load Stories + Scenarios + Tests, paint test borders with latest execution status, and scan the map: requirement clusters with failing automation sitting right next to the plans they should cover—without walking each story’s link tree.

Duplicate / lookalike issue clusters

Load Issues alone with severity borders. Twin bugs filed weeks apart with different titles collapse into neighborhoods. Open the sidebar, mark distinct where needed, or file cleanup when it’s a true duplicate.

Close semantic coverage gaps

Put Scenarios + Tests (or Events + Tests) on one canvas. Select an unlinked scenario or hot TrueCoverage event → Close by tests ranks peers by cosine similarity → Link the near-miss that should have been wired months ago.

Requirement overlap before you plan more

Plot Stories + Scenarios. Dense blobs often mean one idea wearing three titles—or a story that needs a scenario split—before you (or an agent) author more surface area.

TrueCoverage hotspots vs automation islands

Add Events with has test coverage borders. Uncovered events that sit next to well-covered automation clusters are high-ROI gaps: instrumentation, missing emits, or a test that almost covers the behaviour.

We already open-sourced the suite-side cousin—Semantic Graph for Playwright folders. Semantic Canvas brings the same instinct into the product graph: not just tests vs tests, but cross-type meaning across your QA entities.

SurfacePrimary question
InfiniTraceWhat is structurally linked—and what’s a semantic near-miss on the next board?
Semantic CanvasWhat clusters by meaning—and what should I link or dedupe right here?

Same underlying entities. Same link rules. Two complementary ways to see the graph.


The sidebar is where the work happens

The canvas orients you. The detail sidebar decides.

Select a node and you get accordion lists ranked by cosine similarity—not by how close the dots look after UMAP squashed the space into 2D (those can disagree; trust the scores for linking).

SectionJob
Similar <same type>Spot duplicates and over-similar peers
Close by <other type>Cross-type near-misses among types on the canvas

Tune a cosine cutoff per source→target pair. Raise it when you’re hunting true duplicates; lower it when you’re fishing for coverage gaps.

Then act:

  • Link — same model as InfiniTrace (including story↔scenario mappings and scenario annotation injection for scenario↔test)
  • Mark as distinct — teach the system “similar ≠ duplicate”
  • Create issue for duplicate — turn a lookalike pair into cleanup work
  • View details — read-only modal, then jump to the full page when you need to edit

If a card that looks nearby on the map falls below your cutoff, that’s not a bug—that’s the difference between a 2D sketch and embedding space. The sidebar keeps you honest.


Borders that mean something

Pretty clusters aren’t enough. You need health overlays.

Per type, paint node borders with operational signal:

  • Latest execution status on tests / scenarios
  • Priority / severity and due status on stories, scenarios, issues
  • Has linked test on scenarios
  • Has test coverage on TrueCoverage events

Drop Stories + Scenarios + Tests with execution status on the tests, and the map stops being art: requirement neighborhoods with live automation health.

Or load Issues alone with severity borders—and watch lookalike bugs collapse into clusters you can actually triage.

Combine that with folder filters and status chips for sharper triage: failing tests next to the stories they should cover, severity islands of duplicate bugs, uncovered hot events next to automation islands.


Dashboards tell you what’s trending.

Atlas tells you where in the product structure something lives.

TrueCoverage tells you what real users do versus what tests cover.

InfiniTrace tells you how the pieces connect via explicit edges.

Semantic Canvas tells you what belongs together by meaning—even when the link was never created—and where quiet duplicates and near-misses still hide.

That’s the difference between knowing coverage is “82%” and seeing the blob of scenarios that are really one idea wearing three costumes.

Go open QA Brain → Semantic Canvas. Load Stories, Scenarios, and Tests with execution status—or Issues with severity—and click something you think is unique. If the sidebar shows a 90% twin you forgot existed… good. That’s the product working.

Full walkthrough: Semantic Canvas docs.
Pair it with: InfiniTrace.

InfiniTrace: Your QA Knowledge Graph, Finally Walkable

· 4 min read
Nuwan Samarasekera
Founder & CEO, TestChimp

TL;DR: QA revolves around a handful of core entities—stories, scenarios, tests, executions, issues, releases, screens—and they aren’t isolated: stories are verified by scenarios, scenarios by tests, tests produce executions, issues trace back to failures. For most teams, that knowledge lives scattered across disconnected tools, so following the thread means hopping platforms. TestChimp already consolidates those entities and relationships in one place. InfiniTrace (in QA Brain) turns that graph into an infinite board chain: pick a start, fan out to related types, and walk Linked vs Non-Linked entities—including semantic near-misses you can link in place.

InfiniTrace in QA Brain


The graph was always there

Think about a single question a QA lead asks fifty times a week:

“What actually covers this story—and what didn’t we link yet?”

Or:

“This production event is hot in TrueCoverage. Which tests emit it?”

Or:

“This ExploreChimp journey found a bug. How does it connect back to plans and automation?”

Those aren’t dashboard questions. They’re traversal questions.

Traditionally, answering them meant hopping across Jira, a test runner, a coverage tool, an issue tracker—each holding a slice of the story, none holding the whole graph. TestChimp already consolidates those entities and their relationships in one platform: entity links, scenario annotations in SmartTests, SmartTest event emissions, exploration → journey structure, release and run context. The knowledge graph was real. What was missing was a way to walk it.

We’ve been cooking something for that.


Introducing InfiniTrace

InfiniTrace is a horizontal link explorer for your project’s QA entities.

Open QA Brain in the sidebar → InfiniTrace tab.

You get boards—columns—like a kanban that never pretends to be a static board. Each board is an entity type. Board N shows what’s related to the card you selected on board N−1.

  1. Choose where to start — Story, Scenario, Test, Issue, Event, Release, …
  2. Select a card → it lifts; floating CTAs show related types you can fan out to
  3. The next board fills with Linked entities (structural edges)
  4. Open Non-Linked for top-N peers—often ranked by semantic proximity
  5. Keep walking. Boards grow to the right. Change a mid-chain pick and the obsolete boards fall away

Deep links encode the whole chain in the URL (?locator=), so “look at this path” is a share, not a screenshot.

Docs: InfiniTrace.


Linked vs Non-Linked is the point

Structural links are great when they exist.

The interesting work often sits in the gap: things that should be linked, or are nearly the same idea in embedding space, but aren’t wired yet.

That’s why every follow-on board has two panes:

PaneJob
LinkedGround truth from entity links and type adapters
Non-LinkedCandidates—default sort by semantic proximity where embeddings exist

From Non-Linked you can Link (when rules allow) or Create issue—without losing the chain you were walking.

Some edges stay derived (for example TEST ↔ EVENT from RUM / SmartTest emissions). InfiniTrace shows them; it doesn’t pretend every edge is a manual click.


Why this matters for agents too

Humans aren’t the only consumers of this graph.

The same related-entity query model is what we want agents to use via CLI / MCP later: “give me type X related to entity Y, ordered by this strategy, filtered like this, top N.” InfiniTrace is the human-shaped surface of that API.

If you’ve been following our build-in-public arc—policy-traceable workflows, TrueCoverage, plans-as-code—the theme is the same: don’t hide the structure agents need in chat history. Put it in durable, queryable form.

InfiniTrace makes that structure visible and walkable for people first.


What you can actually do with it today

A few chains that already earn their keep:

  • Story → Scenario → Test → Execution — coverage and run health in one pass
  • Event → Test — TrueCoverage hotspots meet automation identity
  • Release / Test run → scenarios & executions — release triage without ten tabs
  • Exploration → Journey → Issues / Tests — exploratory findings with lineage

Filter, search, sort per board. View details in a read-only modal. Jump to the full entity page when you need to edit.


From scavenging to tracing

Dashboards tell you what’s trending.

Atlas tells you where in the product structure something lives.

TrueCoverage tells you what real users do versus what tests cover.

InfiniTrace tells you how the pieces connect—and where the graph is still incomplete.

That’s the difference between staring at metrics and actually following the thread.

Go open QA Brain → InfiniTrace, pick a story or a hot event, and walk it. If the Non-Linked pane surprises you with a near-miss that should have been linked months ago… good. That’s the product working.

Full walkthrough: InfiniTrace docs.

Policy-Traceable Workflows: Close the Loop on Agent Outcomes

· 7 min read
Nuwan Samarasekera
Founder & CEO, TestChimp

TL;DR: Loops are winning in prompting because you can trace outcome quality back to the prompt and improve it. We’ve deconstructed agentic SDLC work into <workflow> + <task description> + <behaviour guidance>, catalogued ~12 modular QA workflows (plus composites like run-qa and upkeep), and put the behaviour piece in version-controlled policies in your repo. Every workflow execution records policy file · version · git SHA—so outcome data can feed back into the policy. From ad-hoc gut-feel prompting → traceable, structured, modular workflows.

From ad-hoc prompting to policy-traceable workflows


Loops win when you can close them

Loops are all the rage in prompting today—and rightly so.

If you can trace the quality of an agent’s work back to the prompt, you get a feedback loop.

Better prompts → better outcomes.

We’ve been cooking something along those lines. But instead of treating every agent invocation as a raw blob of prompt text, we deconstructed agentic interactions a bit first.


Most agent work is three parts

Look carefully at how agents are actually used in the SDLC. Most interactions are of the form:

<workflow> + <task description> + <behaviour guidance>

What’s interesting is that the first part has a surprisingly small vocabulary.

Author Story. Implement Task. Write Tests. Fix Issue. Fix Test Failure…

For QA, we found these distill into around 12 core workflows—plus a couple of composites for shorthand (run-qa, upkeep). The Workflows catalog is that vocabulary: modular playbooks the skill and the platform share.

From there, outcome quality mostly depends on two things:

LeverWhat it isWhat goes wrong when it’s weak
Task descriptionThe what—story, bug, failing batch, scopeVague inputs → confident wrong work
Behavioural guidanceThe how—conventions, env strategy, quality bar, team “tricks”Same task, wildly different agent behaviour per person / day

Today, both still happen ad-hoc—with gut feel. Someone pastes a long prompt, tweaks a line that “felt” important last time, and hopes the next run is better. There is no durable artifact to improve. There is no evidence trail tying this outcome to that guidance.


We already hardened the task side

We’ve been attacking the task-description lever for a while:

  • DeFOSPAM requirement quality checks — score and fix ambiguous specs before agents spend tokens implementing or automating them
  • Rich context for failures — fix-test-execution and related workflows pull execution detail instead of “tests are red, please fix”
  • Test Planning as Code — stories and scenarios as markdown in Git, so the task itself is structured and agent-readable

That closes one half of the loop: better inputs into the agent.

The other half—how the agent should approach the work for your team—was still mostly vibes in a system prompt.


Introducing policy-traceable workflows

Today we’re making that second lever first-class: policy-traceable workflows.

Each catalog workflow is backed by an optional policy—a Markdown file that defines how the agent should approach the task for your project. Policies are not secret sauce buried in a chat window. They live in your repository:

plans/knowledge/policies/*.policy.md

Version-controlled. Reviewable in PRs. Shared team-wide. Same files local /testchimp runs and Automations use.

---
workflow-id: implement
version: 1.2.0
---

Playbooks stay generic (the battle-tested skill steps). Policies hold the project choices: scoping rules, environment strategy, which composite subflows to run or skip, quality bars, exclusions, domain quirks.

Author or refresh them with /testchimp create policy <workflow-id>. Bump version whenever guidance changes—that version is what makes the loop measurable.

Full model: Workflows · Policies.


Trace every execution to policy · version · SHA

A policy you can’t attribute is just another prompt.

For Plan → approve → Execute runs, the agent mints a stable workflow_execution_id, then reports mutative actions with:

  • which policy file was used
  • the policy version
  • the git SHA it came from

…alongside workflow id, actor, branch, and entity identity. That lands on the Workflows execution timeline in TestChimp—not only in chat history that evaporates when the session ends.

The result is data you can use to improve policies. Data you can feed to an agent alongside the existing policy—to iterate on it.

SignalWhat you might do
Stories implemented under policy v1.1 keep producing the same class of bugsPolicy is missing domain knowledge—add it, bump to v1.2
Two ExploreChimp policies, same app pathsKeep the one whose findings your team actually acts on
Smoke vs full run-qa variantsCompare outcome quality and cost without forking the skill
Flaky-fix runs under a “forbid large refactors” ruleTighten or loosen the bar with evidence, not instinct

Instead of tweaking prompts based on gut feel, you iterate on policies using evidence.


Ad-hoc prompting → modular, traceable workflows

Put it together:

  1. Small vocabulary of workflows — implement, create-tests, fix-issue, fix-test-execution, run-explorechimp, … plus composites
  2. Context-rich tasks — governed requirements, execution detail, scoped branch diffs
  3. Versioned behavioural guidance*.policy.md in Git
  4. Attribution on every run — policy file + version + git SHA on the execution timeline
  5. Evidence → next policy version — close the loop

That is the same philosophy as skills as SaaS distribution (the playbook travels with the agent) and boiling the QA lake (agents in a continuous feedback loop)—applied to the behaviour contract itself.

From ad-hoc prompting → to traceable, structured, modular workflows.


Frequently asked questions

What is a workflow policy?

A policy is a project-owned Markdown file (plans/knowledge/policies/*.policy.md) that tells the agent how to run a catalog workflow for your team—scoping, env, quality bar, composite subflows, exclusions—without rewriting the skill playbook.

How is this different from a system prompt or CLAUDE.md?

Those are useful, but usually opaque and hard to A/B. Policies are per-workflow, semver’d, synced to the platform, and recorded on every execution with file name, version, and git SHA—so you can compare runs and improve the guidance with evidence.

Do I need a policy for every workflow?

Defaults are seeded for common composites (run-qa, upkeep) on /testchimp init. Some workflows (notably connect-to-test-env) need an explicit policy before dependent automation stays healthy. Atomic workflows can fall back to broader instructions—but named policies are what make optimization and auditability real.

How do I try an alternate policy without changing the default?

Keep implement.policy.md as the team default and pass a variant:

/testchimp implement US-181 --policy implement-strict.policy.md

Same playbook, different behavioural contract. Compare outcomes on the execution timeline.

Where do I see policy traceability?

Executions → Workflow Executions (and the Workflows UI timeline). After mutative actions, reported runs show the policy file and version used for that execution.


Try it

  1. Install the TestChimp skill and map plans/tests in Git
  2. Run /testchimp init (or author policies with /testchimp create policy <id>)
  3. Open plans/knowledge/policies/*.policy.md, encode one team convention, bump version
  4. Run a workflow (/testchimp implement …, /testchimp run QA, …)
  5. Check Workflow Executions for policy file · version · SHA—then improve the policy from what you see

Start here:

Better policies → better outcomes. Now you can prove which version got you there.


Further reading

TestChimp

Related posts

Concepts

Put QA on Auto-Pilot with Workflow Automations

· 8 min read
Nuwan Samarasekera
Founder & CEO, TestChimp

TL;DR: We’ve shipped Automations in TestChimp—event-driven runs of the same catalog workflows you already invoke with /testchimp. When an issue is created, a story moves to ready, a CI batch fails, or a release lifecycle status changes, TestChimp can hand the work to a cloud agent via OpenHands or a labelled GitHub Issue. Aggregation collapses noisy bursts; optional human gates keep high-blast-radius runs under review. Local agents stay for interactive work. Automations cover the complementary case: the platform watches, then starts the agent for you.

Configure an automation trigger — entity, event, and conditions


The prompt-pasting tax

If you’ve been living in the agentic QA loop, you already know the playbooks:

/testchimp fix issue BUG-1042
/testchimp implement US-181
/testchimp fix test execution …
/testchimp run QA

That works. It also creates a new bottleneck: someone has to notice the event and paste the prompt.

Failure modeWhat actually happens
LatencyHigh-severity bug sits until a human opens the IDE
InconsistencyDifferent people phrase the same job differently
Missed signalsFailed CI batch, ready story, release → Ready—none of them auto-start work
No audit trailChat history ≠ a tracked workflow execution with status and policy version
Noisy burstsTen related failures → ten agent sessions unless someone batches by hand

Agents compressed execution. They did not invent routing. Automations are that routing layer—on the same workflows, policies, and workflow-execution-id traceability you already use.

Full product docs: Automations.


What is a TestChimp automation?

An automation is three parts:

Trigger + Action + Config

PartAnswersExamples
TriggerWhen?Entity (issue, story, scenario, test execution, batch, release) + event + optional AND conditions
ActionWhat?Execute a catalog workflow with a task template, optional policy, and invocation strategy
ConfigHow loudly / how carefully?Aggregation (Immediate / Buffered / Windowed) + optional human approval before invoke and/or before plan execute

Policies stay *.policy.md in Git. Automations optionally attach them—the same files local /testchimp runs use. Workflows still define how the agent works. Automations define when that work starts and how the cloud agent is reached.

Project event → matching automation → aggregation window

workflow execution queued

(optional) human approve invoke / plan

OpenHands conversation or labelled GitHub Issue

/testchimp <workflow> … --workflow-execution-id …

Two ways to reach a cloud agent

Configure once under Project Settings → Automations, then pick a strategy per automation.

Via GitHub Issue (great default when Git is connected)

TestChimp opens an issue on your mapped repo. Body = the full /testchimp … prompt (plus the workflow execution id). Labels always include testchimp, plus any extras you configure.

Point Copilot coding agent, an OpenHands issue resolver, Codex, or your own runner at those labels. The agent checks out the repo, runs the prompt with the TestChimp skill + MCP, and reports back—so Executions → Workflow Executions stays current.

Via OpenHands

TestChimp starts an OpenHands conversation with the rendered prompt (and branch when known). Same project OpenHands config you may already use for one-click bug fixes / OpenHands integration.

OpenHandsVia GitHub Issue
Who starts the agentTestChimp (API)Your label-watching agent
NeedsOpenHands API key + mapped GitHub repoTestChimp GitHub App + repo
Continuation (plan → execute)New conversationComment on the same issue
FitYou standardize on OpenHandsYou want any GitHub-native agent queue

Deep dive: Cloud agents for automations.

Configure the automation action — workflow, task template, policy, invocation strategy


Aggregation and human gates (because autonomy without brakes is chaos)

Matching events should not always mean “spawn an agent immediately.”

PolicyBehaviour
ImmediateEvery match fulfills (still subject to the project hourly cap)
Buffered (default)Wait for a quiet period (≥ 5 minutes), bounded by max window / max event count
WindowedFulfill on fixed hour boundaries—digest style

Default rate limit: 5 cloud agent invocations per hour per project (shared). Over-cap runs stay Queued—not dropped.

Two independent human gates (off by default):

  1. Approve before invoke — review the rendered task before the cloud agent starts
  2. Approve before plan execute — agent plans first; you approve before execute

Pending work surfaces in Executions → Workflow Executions. You can also copy the prompt and run it locally—the workflow-execution-id keeps the timeline accurate either way.

Mechanics: How automations work.


Recipes teams actually want

SignalWorkflowNotes
High-severity issue created (not ExploreChimp noise)fix-issueImmediate or short buffer; start with invoke approval
Story / scenario → readyimplementBuffered; prefer plan-execute approval
Automation batch status → failedfix-test-execution / upkeepBuffered so one CI push → one agent run
Release → Readyrun-qa / run-release-checkImmediate; gate the composite
Steady drip of ready workupkeepWindowed hourly/daily digest

Task templates use {{issue.id}}, {{story.title}}, {{batch.failed_count}}, {{project.repo_url}}, and friends—with autocomplete in the wizard.

More starters: Typical automation setups.


Why this matters in the agentic era

We already argued that skills are SaaS distribution—the playbook travels with the agent. We argued that requirements must be governed before agents spend tokens. We argued that release governance is the ship decision, not a spreadsheet.

Automations close another gap: intent without attendance.

Without them, QA-on-autopilot still needs a human dispatcher. With them, the same /testchimp catalog becomes a control plane: events in → policy-backed workflow executions out → auditable status in the product. Local Claude / Cursor for interactive loops. Cloud agents for the overnight and the “while you were in standup” cases.

That is how you boil the lake without standing next to the kettle (boiling the QA lake).


Frequently asked questions

What are TestChimp Automations?

Automations are event-driven rules that run TestChimp catalog workflows via a cloud agent when something changes in your project—issues, stories, scenarios, test executions, CI batches, or releases—optionally aggregated and gated by human approval.

How do Automations differ from Workflows?

Workflows define how an agent should work (skill playbook + optional policy). Automations define when that work starts and which cloud invocation path to use. Both share the same execution timeline and workflow-execution-id reporting.

OpenHands vs GitHub Issue—which should I pick?

Use GitHub Issue if you want any label-watching coding agent (Copilot, OpenHands resolver, Codex, custom bots) and already have the TestChimp GitHub App. Use OpenHands if TestChimp should start the conversation directly and you standardize on OpenHands cloud or self-hosted.

Will Automations spam my agents on every CI flake?

Not if you configure them well. Prefer Buffered aggregation for batches, exclude ExploreChimp reporters on auto-fix rules, use conditions (status = BATCH_INVOCATION_FAILED, severity = HIGH), and keep the project hourly invocation cap. High-risk workflows should start with human gates on.

Can I still run workflows locally?

Yes. Automations don’t replace /testchimp in your IDE. From a pending execution you can also copy the prompt—including the workflow execution id—and run it with a local agent so status still updates in TestChimp.

Where do I create and monitor Automations?

Create under Workflows → Automations (or contextual Automations CTAs on Issues, Plans, batches, releases, and workflow pages). Configure strategies and rate limits in Project Settings → Automations. Monitor and approve under Executions → Workflow Executions.


Try it

  1. Connect GitHub (and optionally OpenHands) under Project Settings → Automations
  2. Open Workflows → Automations → Create Automation
  3. Pick a trigger (start from a popular condition template)
  4. Choose a workflow, task template, policy, and invocation strategy
  5. Leave Buffered aggregation on; add invoke or plan-execute approval for risky jobs
  6. Trigger a matching event—then watch Workflow Executions

Start here:

When something changes, the agent should already be working—not waiting for you to paste a prompt.


Further reading

TestChimp

Related posts

Concepts

Your Agents Are Only as Good as Your Requirements

· 6 min read
Nuwan Samarasekera
Founder & CEO, TestChimp

We’ve spent a lot of energy making agents better at writing code and tests.

We’ve spent far less making the inputs to those agents less terrible.

Most modern teams don’t have an “AI coding” problem. They have a requirements problem—and agents make it louder. Give Claude a vague story with “fast,” “easy,” and a missing error path, and it will happily invent behaviour. Give Playwright-authoring agents an untestable scenario, and they will automate the guess. Garbage in doesn’t just produce garbage out anymore. It produces confident garbage—at merge velocity.

That isn’t a new insight in software engineering. It’s just newly expensive.


We’ve known what “good” looks like for decades

Quality requirements aren’t a 2026 invention.

Agile teams have INVEST (Independent, Negotiable, Valuable, Estimable, Small, Testable)—Bill Wake’s checklist for backlog items that don’t sabotage the sprint. The “T” is the one that keeps biting agentic workflows: if you can’t write a test for it in principle, you don’t have a requirement—you have a vibe.

Formal requirements engineering went further. ISO/IEC/IEEE 29148 spells out characteristics like unambiguous, complete, singular, and verifiable—measurable properties of a requirement, not a gut feel in a grooming meeting. Industry write-ups of the standard make the same point in plain language: “user-friendly” isn’t a requirement; a verifiable threshold is (overview of ISO 29148 quality criteria).

And for scenario thinking, Specification by Example and Given-When-Then have been the antidote to “as a user I want stuff so that value” for years.

The gap was never knowing. The gap was doing it continuously, on every story, without a two-day workshop and a whiteboard full of sticky notes.


Enter DeFOSPAM

DeFOSPAM is a seven-lens mnemonic from Paul Gerrard’s Business Story Method (with Jonathon Wright / OpenTest.AI)—popularized recently by OpenRequirements.AI as an agentic requirements-validation approach. The goal is blunt:

A perfect requirement lets the reader predict the behaviour of every feature in all circumstances.

Where that prediction fails, DeFOSPAM tells you why—systematically:

LensWhat it attacks
DefinitionsUndefined terms, synonym collisions, glossary gaps
FeaturesUnclear scope, mixed concerns, incomplete decomposition
OutcomesMissing or unmeasurable “so that…” value
ScenariosHappy-path-only coverage; missing edges and errors
PredictionSteps without verifiable expected results
AmbiguityWeasel words, open-ended “etc.”, unclear actors
MissingActors, data, NFRs, acceptance criteria, cross-cuts

Paul has talked about this as structured appraisal of requirements for years—including how AI can help walk the checklist without replacing human judgment (Analyzing and improving requirements — Richard Seidl podcast). OpenRequirements frames the same idea as specialist analyst agents over living documentation (OpenRequirements.AI; methodology notes on GitHub).

We didn’t invent DeFOSPAM. We operationalized it where our plans already live.


Requirement quality governance in TestChimp

If you’ve been following us, you know the thesis: Test Planning as Code—stories and scenarios as markdown in Git, workflows layered on for humans, context for agents. Traceability without the spreadsheet circus (requirement traceability).

The next piece is governance: not just having plans, but knowing whether those plans are good enough for agents to build and test against.

Requirement quality governance in TestChimp

In TestChimp you can run agentic DeFOSPAM-style checks on a story, a scenario, or a plans folder. What you get back isn’t a vague “needs more detail” comment:

  1. Scores across clarity, completeness, testability, consistency, ambiguity risk, and scenario coverage—plus an overall score
  2. Findings with severity (critical / major / minor)
  3. Suggested fixes you can apply or ignore
  4. Tracked state in Plans → Insights → Requirement quality, so quality is a backlog you can govern—not a chat transcript that evaporates

Applied and ignored findings stay out of the penalty box on re-score. The board shows remaining work.

Full walkthrough: Requirement Quality Governance. Agent playbook: /testchimp analyze requirement quality.


Cloud vs local agent: pick for context, not vibes

There are two ways to run the checks.

TestChimp Cloud — one click from the story/scenario editor. Fast. No IDE setup. Costs an AI credit. Great when you want a quality pass without leaving the platform.

Local coding agent (recommended when you can) — install the TestChimp skill and run:

/testchimp analyze requirement quality of US-181
/testchimp analyze requirement quality of plans/stories/billing

Why we recommend local when it fits: the agent can ground findings in your code—fixtures, seed routes, existing scenarios, how “subscription” is actually modelled. Cloud is the simpler path; local is the richer one. Same governance surface either way—results land in Insights.

Authoring fits the same loop. Upskill the agent, then:

/testchimp author story for <objective>

Playbook: Author Plans. Docs: Authoring test scenarios.


Why this matters now

In a human-only world, ambiguous requirements wasted meetings and produced “works as designed” arguments.

In an agentic world, they waste tokens, CI minutes, and PR cycles—and they poison the feedback loop we care about: planned reality → tested reality → production reality (boiling the QA lake).

Agents are extraordinary executors. They are mediocre mind-readers.

If you want high-quality dev output and high-quality test output, start earlier than /testchimp test. Harden the story. Score it. Fix the critical findings. Then let agents implement and automate.

Requirements stop being static tickets. They become governed assets—the same way we already treat code.


Wrapping up

We believe the next leverage in agentic QA isn’t another “generate tests” button. It’s making the contract agents work from clear, detailed, and unambiguous—and keeping that quality visible over time.

DeFOSPAM gives the lenses. INVEST and ISO 29148 gave the vocabulary. TestChimp puts governance on the plans you already sync to Git.

If that resonates, start here:


References and further reading

How to Find Duplicate Tests in a Playwright Suite (Semantic Graph for Agentic QA)

· 10 min read
Nuwan Samarasekera
Founder & CEO, TestChimp

TL;DR: When coding agents can write dozens of Playwright tests in a single session, the bottleneck shifts from authoring to governance: are the new tests distinct and useful, or just near-duplicates of what you already have? Semantic Graph is a free, open-source CLI that scans your suite, embeds each test semantically, clusters related tests, and renders an interactive graph so you—and your agent—can spot redundancy before it compounds.

Semantic Graph visualization — folder tree, 2D similarity graph, and cluster list view


The new problem: agents author tests en masse

For most of the last decade, the hard part of E2E testing was throughput: humans could not write and maintain enough tests to keep up with product velocity.

That constraint is collapsing. With Claude Code, Cursor, and agent skills like the TestChimp skill, a single prompt can produce a folder of well-formed Playwright specs in minutes. Coverage gaps that used to take a sprint to close can shrink to an afternoon.

The bottleneck has moved.

EraPrimary constraintWhat "good" looked like
Manual QAAuthoring speedEnough tests to cover the happy path
Human + low-code toolsUI-layer setup frictionStable POMs, fewer flakes
Agentic QASuite quality at scaleDistinct, high-signal tests—not copies

When an agent is rewarded for adding tests—closing coverage gaps, responding to PR feedback, or filling in scenarios from a test plan—it has no innate sense of "this already exists, slightly reworded." Left unchecked, suites balloon with:

  • Duplicate tests that assert the same behaviour under different titles
  • Near-duplicates that differ only in fixture data or selector phrasing
  • Clustered redundancy where five tests all exercise the same checkout edge case
  • Invisible overlap across folders, because no human (and no agent) holds the entire suite in working memory

This is the QA equivalent of boiling the lake in the wrong direction: lots of heat, little new coverage. Worse, duplicate tests inflate CI time, confuse failure triage, and give a false sense of depth—your line count grows while your behavioural breadth stalls.

The question is no longer "Can we write more tests?" It is:

"Are we writing useful, distinct tests—or just duplicative ones?"

That question needs a semantic answer, not a filename diff.


What is Semantic Graph?

Semantic Graph is an open-source tool from TestChimp that maps your Playwright test suite by meaning, not syntax.

It is published as @testchimp/semantic-graph on npm and lives in the TestChimp/semantic-graph repository. Run one command against your tests directory; the CLI:

  1. Scans *.spec.ts, *.test.ts, and related Playwright files
  2. Parses each test's suite path, title, intent comments, scenario annotations, and body
  3. Embeds the canonical test text with an embedding model (OpenAI or Voyage AI)
  4. Clusters tests by semantic similarity using DBSCAN
  5. Lays out a 2D graph with UMAP so similar tests appear close together
  6. Names clusters with a lightweight LLM pass (e.g. "auth", "checkout", "api-contracts")
  7. Serves a local interactive UI at http://localhost:3859

No database. No TestChimp account required. Embeddings are computed in memory each run—ideal for local audits, pre-merge reviews, or giving an agent a structural view of the suite before it authors more tests.


How it works (the pipeline)

Understanding the pipeline helps you interpret the graph—and tune how agents use it.

1. Parse tests into embedding-ready text

The core library (@testchimp/semantic-graph-core) includes a vendored Playwright-aware parser. For each test it builds canonical text:

Suite: checkout > guest flow
Test: rejects expired coupon at payment step
Body:
Scenario: Guest checkout with invalid coupon
// intent: verify error copy and no charge created
await page.goto('/checkout');
...

Parsing captures intent comments and scenario annotations—the same metadata agents should be authoring anyway when following requirement traceability conventions. Two tests with different selectors but the same intent will land close together in embedding space.

2. Embed with cosine similarity

Each test's text is sent to an embedding API in batches (default model: text-embedding-3-small for OpenAI, voyage-4 for Voyage). The tool computes cosine similarity between vectors and applies configurable thresholds:

SignalDefault thresholdMeaning
Graph edge≥ 0.75Tests are semantically related
Similar≥ 0.80Worth reviewing together
Potential duplicate≥ 0.92Strong dedup candidate

These thresholds mirror how humans judge redundancy: not byte-identical, but "would a failure in one make the other pointless?"

3. Cluster with DBSCAN

Similar embeddings are grouped with DBSCAN density clustering—no need to pick k clusters upfront. Each cluster gets an LLM-generated label (e.g. "settings-page", "admin-tasks") so the legend is readable at a glance.

4. Visualize with UMAP + D3

A seeded UMAP projection maps high-dimensional embeddings to 2D coordinates. The bundled UI (built with D3.js) renders:

  • Graph view — nodes as tests, edges as similarity links; click a node to see nearest neighbours and duplicate flags
  • Clusters view — grouped list with colour-coded legend
  • Folder tree — scope the graph to a directory or single file

Zoom into tests/checkout/ before a refactor. Scan the whole suite before a release. Hand the URL to an agent and ask it to propose merges.


Why this matters for agentic QA workflows

Semantic Graph is not a replacement for TrueCoverage—production-informed prioritization—or requirement traceability. It solves a orthogonal problem: intra-suite redundancy.

Here is where it fits in a modern agent loop:

Before the agent writes

Run Semantic Graph and attach the cluster summary to the agent's context. Instructions become concrete:

"We already have four tests in the checkout cluster covering coupon validation. Do not add another unless you are testing a different failure mode."

This is cheaper and more reliable than asking the agent to grep test titles.

After the agent writes

Re-run the graph on the PR branch. New nodes that snap onto existing clusters—or spike duplicate scores above 0.92—are review flags. Pair with CI the same way you gate on lint or coverage deltas.

During suite health reviews

Quarterly "suite diet" sessions used to mean spreadsheets and gut feel. Now: filter to clusters with high internal similarity, merge or delete, and measure CI time recovered.

Complement to production signals

TrueCoverage tells you what behaviours users need tested. Semantic Graph tells you whether your existing tests are saying the same thing twice. Both are necessary for a suite that is broad and lean.


What you see in the UI

The demo above shows the full workflow:

  1. Left panel — folder tree mirroring your repo layout; click a folder or file to scope the view
  2. Graph mode — force-directed layout; proximate nodes are semantically alike
  3. Clusters mode — tests bucketed with named themes
  4. Popover — click any test to see top similar neighbours, similarity scores, and potential duplicate badges

The UI ships inside the npm package—no separate install. It is the same "freebie" static app published as @testchimp/semantic-graph-viz in the monorepo for anyone who wants to embed or fork it.


Try it yourself

Prerequisites

  • Node.js 18+
  • An API key for embeddings (and cluster naming):
    • OpenAI — one key covers embeddings + LLM, or
    • Anthropic + VoyageClaude for cluster labels, Voyage for embeddings (Anthropic does not ship an embedding API)

Quick start (OpenAI)

export PROVIDER=openai
export API_KEY=sk-...

npx @testchimp/semantic-graph visualize --tests-dir ./tests

Open the printed URL (default port 3859). Add --verbose for embedding progress and diagnostics.

Claude + Voyage

export PROVIDER=anthropic
export API_KEY=sk-ant-...
export VOYAGE_API_KEY=pa-...

npx @testchimp/semantic-graph visualize --tests-dir ./tests

All options

FlagDescription
--tests-dir <path>Root folder to scan (required)
--port <n>Listen port (default 3859)
--verbose / -vDiagnostics to stderr

See the README for environment variables, monorepo build instructions, and npm publish details.


Continuous governance with TestChimp

Semantic Graph is deliberately local and standalone—a flashlight you can shine on any Playwright repo, TestChimp customer or not.

For continuous duplicate detection, requirement traceability, release confidence, and keeping suites healthy as agents keep authoring, see TestChimp—the git-native QA governance platform built for agentic teams. Install the TestChimp Agent Skill and run /testchimp test after each PR to orchestrate coverage, exploration, and plan alignment in one loop.


FAQ

What test file types are supported?

The scanner picks up *.spec.ts, *.spec.js, *.test.ts, *.test.js, and .mjs / .cjs variants under your chosen root—standard Playwright test layouts.

Does it require a TestChimp account?

No. Semantic Graph runs entirely locally. You only need embedding (and optionally LLM) API keys.

How is this different from code coverage?

Code coverage measures which lines executed. Semantic Graph measures whether test intentions overlap. A suite can have high line coverage and still be full of redundant scenarios.

How is this different from duplicate detection by test name?

Titles lie. Agents especially love paraphrasing: "should reject invalid coupon" vs "guest user sees error for expired promo code." Embeddings capture the full body and intent, not the string on line one.

Can I use it in CI?

Today the primary interface is the local visualize command and JSON APIs (/api/graph, /api/similar). For CI gates, parse the API responses or run before review and archive the graph output. Continuous server-side governance is on the TestChimp platform roadmap.

What embedding models are supported?

Defaults: text-embedding-3-small (OpenAI) and voyage-4 (Voyage). Override with EMBEDDING_MODEL. LLM cluster naming defaults to gpt-5-nano or claude-3-5-haiku-latest.

Is the source code open?

Yes. MIT-licensed monorepo: github.com/TestChimp/semantic-graph. Packages: @testchimp/semantic-graph-core, @testchimp/semantic-graph, @testchimp/semantic-graph-viz.


Summary

Agentic QA solved test authoring at scale. The next discipline is test distinctness at scale—ensuring every new spec adds behavioural breadth, not noise.

Semantic Graph gives you a semantic map of your Playwright suite: embeddings for meaning, DBSCAN for clusters, UMAP for intuition, and a local UI for humans and agents alike. Run it before you merge agent-authored tests. Run it when CI gets slow. Run it when you suspect the lake is boiling but not reducing risk.

Get started: github.com/TestChimp/semantic-graph · npx @testchimp/semantic-graph visualize


References and further reading

From Manual Session to Automation Test

· 4 min read
Nuwan Samarasekera
Founder & CEO, TestChimp

Manual testing still finds what automation misses—but too often, the path from a good manual run to a reliable automated test is broken.

Teams try Playwright codegen or record-replay tools, get a script quickly, and then spend weeks fighting flakes: shared data, missing assertions, no link back to the scenario, and no fit with POMs or fixtures already in the repo.

Today we’re announcing a workflow we recommend for turning manual sessions into SmartTests: capture with traceability, then let a coding agent upskilled with TestChimp author automation that actually belongs in your codebase.

Manual session to automation


The problem with “just record it”

Record-replay—including Playwright codegen—optimizes for mirroring UI clicks. That is not the same as authoring a repeatable test.

Real automation needs:

  • Arrange: seed data, fixtures, run-scoped entities
  • Act: the journey that matters (often shorter than what a human clicked through)
  • Assert: UI checks and backend state where outcomes live

Recorders capture the act layer well. They usually skip arrange and assert, and they never know which business scenario you were proving.

The result is familiar: tests that pass once on a developer machine, then fail in CI because the world-state was never set up—or because the script asserts the wrong thing (or nothing at all).


What we do instead

TestChimp connects manual execution, test planning, and agent-authored Playwright in one loop.

1) Capture the manual session—with scenario context

Use the TestChimp Chrome extension Manual tab to record a session while exercising your app. Start from Test Planning so the scenario is pre-linked (recommended), or link a scenario as part of the workflow.

What gets stored:

  • Step-by-step actions and screenshots
  • Linked scenarios (business context)
  • Environment and release metadata
  • Pass/fail outcome and optional bugs/notes

The session is auditable manual evidence and the reference for automation—not a throwaway recording.

2) Generate prompt → coding agent

Open the session in TestChimp (Executions → Manual Sessions) and click Copy test generate prompt. Paste it into your agent host (Cursor, Claude Code, etc.) with the TestChimp skill installed.

The agent pulls rich context via get-manual-session-details (CLI or MCP):

  • Recorded steps
  • Linked scenarios and scenario steps
  • Screenshots for visual grounding
  • Project layout and existing POMs, fixtures, seed/probe endpoints

It uses the manual walkthrough as reference, navigates the app to validate selectors, and writes a SmartTest that reuses your harness—not a blind replay file.

3) Continuous improvement—not one-shot codegen

Authoring does not stop at the first green run. TestChimp’s feedback loop surfaces coverage gaps (planned scenarios and TrueCoverage behaviour signals). Your agent runs /testchimp test on PRs and /testchimp evolve on a schedule or after deploys to close gaps, extend fixtures, and keep tests aligned with how users actually behave (Workflows).

The Web IDE is where you view tests, run them, and see insights aligned with your test folder structure—not where we expect most authoring to happen anymore.


How this differs from record-replay vendors

Tools like mabl, Katalon, and Testim (and codegen at the framework level) center on capture → replay. They can speed up first script creation, but they typically:

  • omit fixture-backed world-state
  • lack in-repo scenario traceability at authoring time
  • rarely generate backend probe assertions
  • produce tests that do not compose with your existing Playwright patterns

TestChimp’s manual-to-auto path is informed agent authoring: session + scenario + screenshots + your repo conventions → repeatable Playwright in Git. See the full comparison: Why record-replay falls short in creating repeatable tests.


When to use which path

SituationWhat we recommend
Exploratory selector discoveryPlaywright codegen or inspector—disposable output
Turning a validated manual scenario into CI automationManual capture → generate prompt → TestChimp agent
Ongoing suite maintenance and gap closure/testchimp evolve + coverage insights
Viewing tests and folder-aligned insightsTestChimp Web IDE

Get started

  1. Install the Chrome extension and add the TestChimp skill to your coding agent.
  2. Capture a manual session from a linked scenario (manual test capture guide).
  3. Copy test generate prompt and let the agent author the SmartTest (Creating SmartTests).
  4. Wire /testchimp test into your PR flow and schedule /testchimp evolve for portfolio upkeep.

Manual testing stays human. Automation becomes engineering-grade—because the agent authors like an engineer who read the scenario, not like a recorder that only heard the clicks.