
2 posts tagged with "Integration"

Integration tag description

View All Tags

From Bug Report to Pull Request: The TestChimp x OpenHands Integration

· 3 min read
Nuwan Samarasekera
Founder & CEO, TestChimp

Let’s be honest. Finding a bug is only the start.

Then comes the context switching – reproducing the issue, digging through logs, writing a fix that doesn’t break something else…

As of today, that workflow is outdated.

Fix Bug Cover

Today, we are launching our OpenHands Integration. This isn’t just a “Chat with AI” wrapper. It is a fully automated pipeline that takes a bug found in TestChimp and turns it into a ready-to-merge Pull Request in your GitHub repository. Here is how it works, why it actually fixes things (instead of hallucinating), and how to set it up.

The "Context Gap" (Why AI usually fails at debugging)

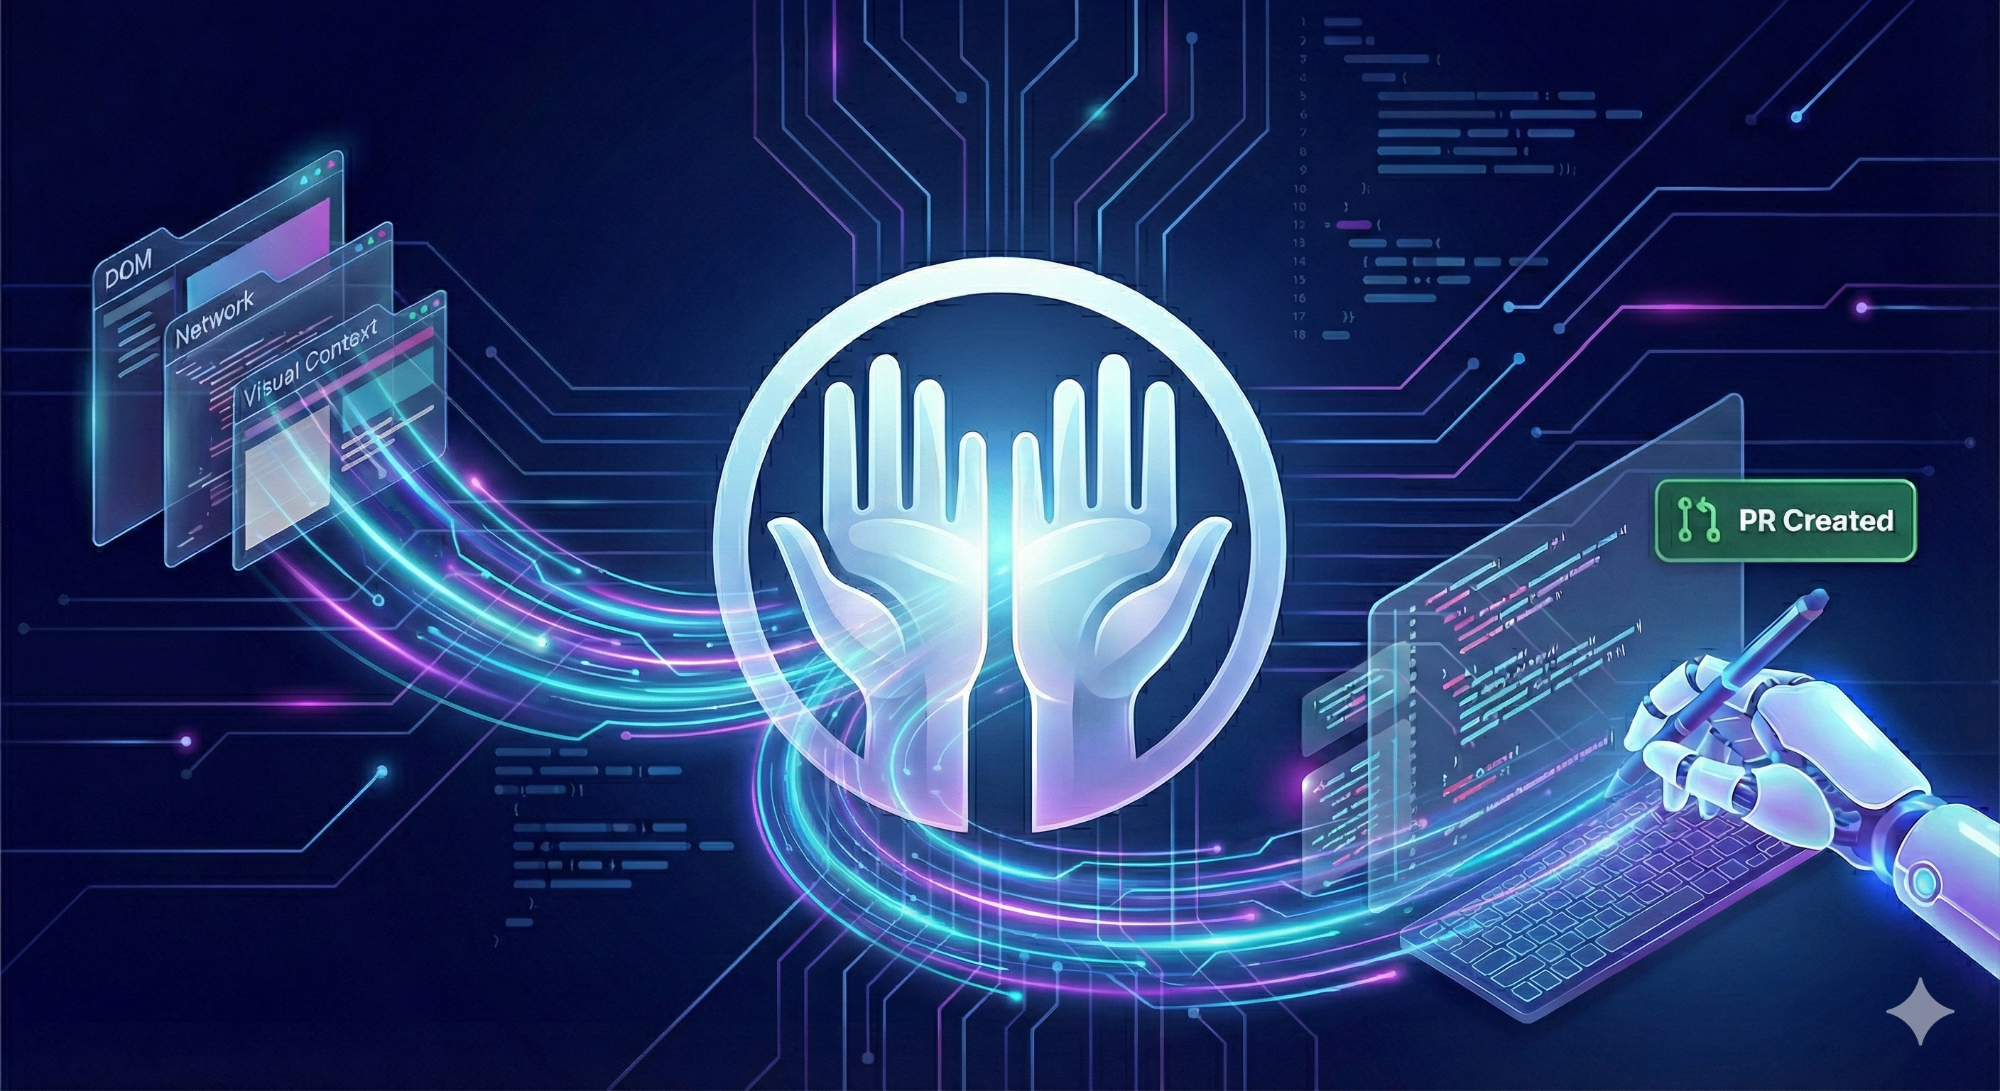
Most AI coding agents are smart, but blind. You tell them “The cart button is broken,” and they hallucinate a fix because they can’t see the state of the application. We solved the Context Gap. When TestChimp captures a bug (whether manually or via our automated agents), we record the entire runtime reality of that failure. When you click “Fix” via the OpenHands integration, we feed the cloud agent the complete necessary context including:

  • Visual Bounding Boxes: We show the agent exactly where the bug is physically located on the screen.

  • API Payloads: The agent sees the actual network requests and response bodies that triggered the error.

  • Console Logs: JavaScript errors, warnings, and stack traces captured at the exact moment of failure.

  • DOM Context: The full element selectors and structure information.

  • Screen-State: Specifics on which screen and state the app was in.

The OpenHands agent doesn’t guess anymore. It fetches these artif acts on-demand, analyzes your codebase, and writes a precise fix.

The Workflow: One Click, Real Code

We built this for speed. Here is what the new flow looks like:

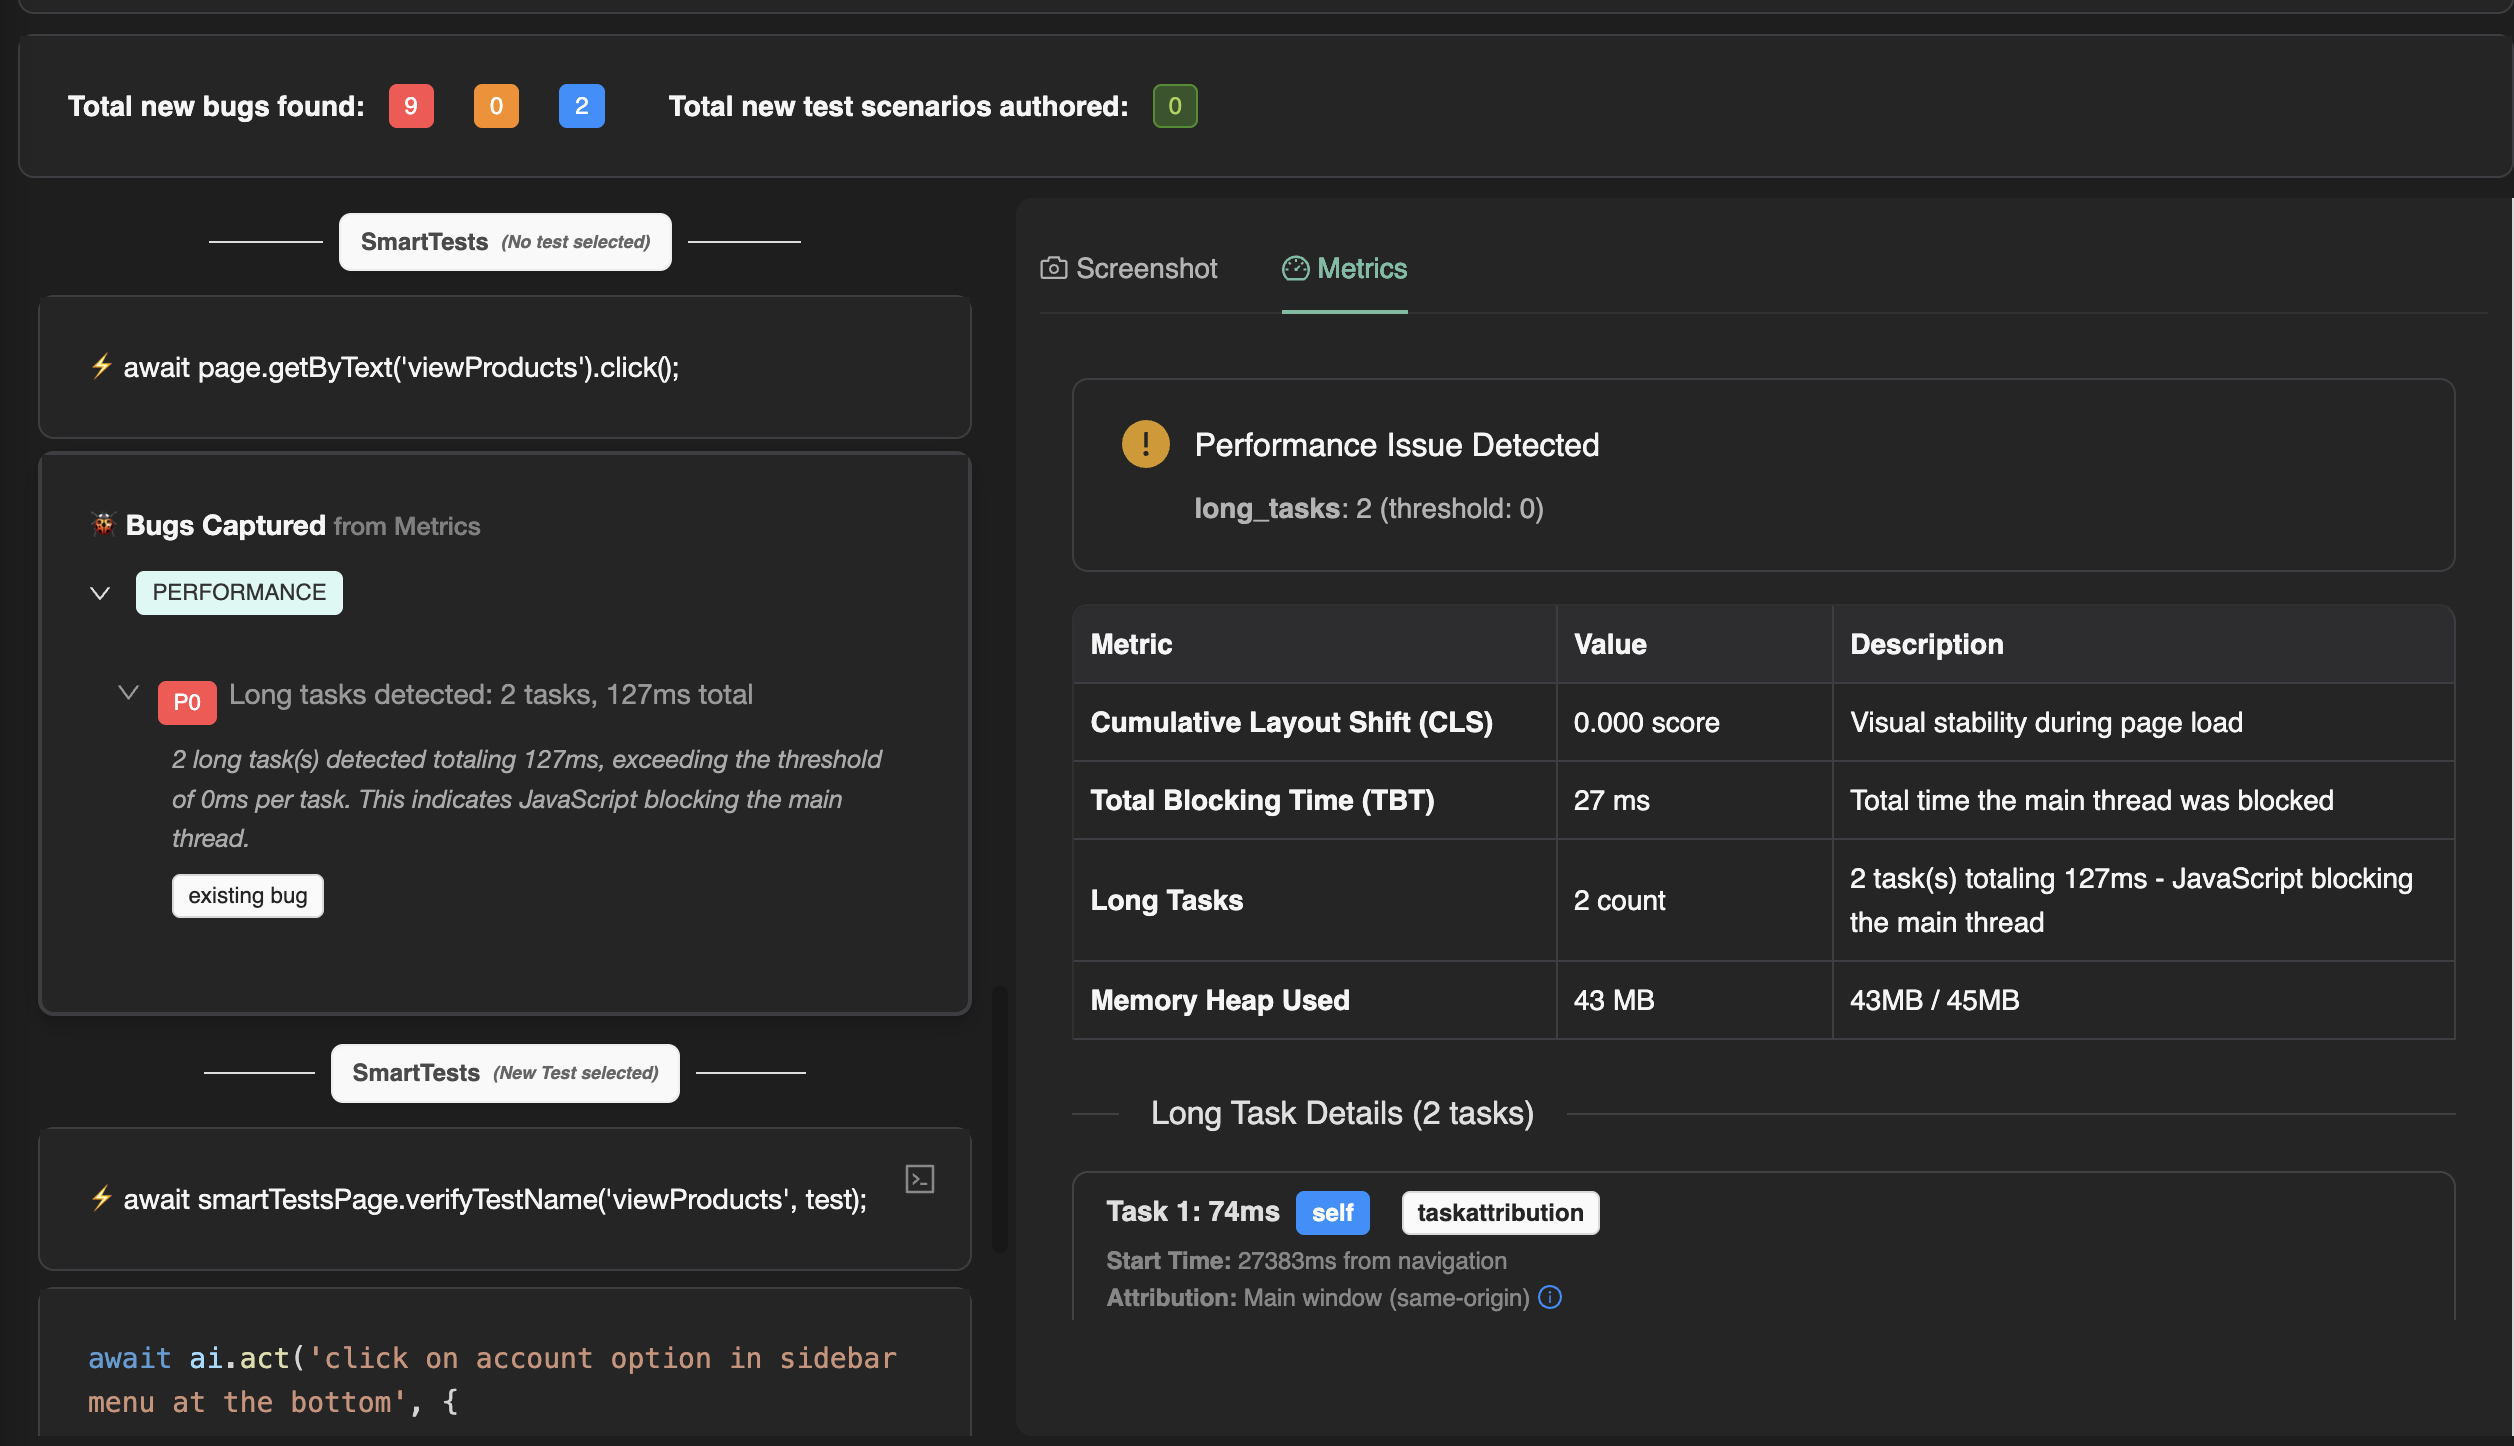
1. Spot the Bug (or Batch Them)

You can select a single bug or use the checkboxes to select multiple bugs at once. If you have five related UI glitches, select them all. The agent is smart enough to identify common issues, group them, and address them together.
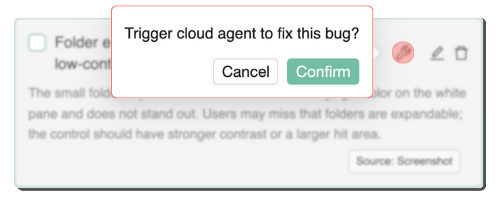
2. Click “Fix”

Hit the tool icon next to the bug. TestChimp validates your config and sends the context package to the OpenHands cloud instance.

Fix Bug Screenshot

3. Watch it Work Live

This is the cool part. We pop a success modal with a direct link to the OpenHands Conversation. You can click that link and watch the agent “think” in real-time. You see it analyzing the screenshots, reading the API logs, and reasoning through the code changes.

4. Review the PR

Once the agent is done, it automatically raises a Pull Request in your connected GitHub repository. You review the code, run your CI, and merge.

Technical Setup (How to turn it on)

This feature is available now for TestChimp Teams subscribers. Prerequisites: You need an OpenHands account (cloud or self-hosted) and your GitHub repository must be connected to both OpenHands and TestChimp. Note: The repo connected in OpenHands must match the repo configured in TestChimp. Configuration Steps:

  • Go to Project Settings -> Integrations -> OpenHands.
  • Enter your OpenHands API Key.
  • Select your Installation Type (Cloud or Self-hosted).
  • Click Save Configuration.

Why this matters

We are moving from “Bug Tracking” to “Bug Killing.” By giving an autonomous agent access to on-demand artifacts like bounding boxes and DOM states, we are removing the manual labor from regression testing. Stop fixing bugs manually. Let the chimp handle it.

The Silent Killer Churning Your Users: Slow, Janky UX

· 3 min read
Nuwan Samarasekera
Founder & CEO, TestChimp

Everyone loves to talk about “building features” and “shipping fast.” But we rarely talk about the thing that silently kills conversions, frustrates users, and destroys retention:

Performance.

Performance bugs cover

Not the “page still loads eventually” kind – but the slow, janky, slightly-off performance that users instantly notice and abandon your product for.

And the data is brutal:

  • Amazon found that a 1-second delay in page load time reduced conversions by 7%.

  • The probability of a bounce increases by 32% as load time goes from 1s → 3s.

  • Apps that invest in performance optimizations see up to 30% higher retention.

Users don’t always tell you this directly, but every UX study confirms it:

Slow, sluggish experiences are one of the most complained-about frustrations – and a top reason users bounce.

But We Already Have Automated Tests… Isn’t Our App “Tested”?

This is the dangerous assumption teams make.

Yes, you may have automation test coverage.

Yes, your flows might “functionally work.”

But functional checks don’t catch:

  • the button that feels slow
  • the layout shift that makes the user misclick
  • the subtle JavaScript bloat that accumulates over releases
  • the screen that takes 1.2s longer than it used to
  • the resource that takes long to load due to cache misconfiguration
  • the memory leak that only appears after a few steps

These aren’t textbook “bugs” so no one files them.

And because performance is subjective (“eh, feels a bit sluggish?”), rarely gets documented with hard numbers.

Result: regressions creep in release after release – until your retention chart quietly slopes downward.

Performance Bug Detection in TestChimp’s Exploratory Agent

To fix this blind spot, TestChimp’s exploratory agent now automatically flags performance and memory issues – alongside the other usability bugs it catches.

And just like other bugs it finds, every performance issue is tied to the exact screen/state it appeared in.

You get a clear map of where your app slows down, why, and by how much.

No more vague complaints.

No more guessing.

Performance bugs, accurately tracked, and backed by hard evidence.

Performance bugs in TestChimp exploratory agent

What the Agent Analyzes

The agent captures and analyzes deep browser performance metrics such as:

  • CLS (Cumulative Layout Shift) – where janky content shifts occur
  • INP (Interaction to Next Paint) – slow button responses, input lag
  • Long Tasks – heavy JS blocking the main thread
  • Large or unoptimized resource loads
  • TBT (Total Blocking Time)
  • Memory heap usage and leaks
  • Network timing and caching misses And more…

Combines this with Screenshot data to highlight:

  • Which screens are causing frustration
  • Which buttons are slow to respond
  • Where layout instability is happening
  • Which resources are dragging down load times
  • Where caching is failing

Essentially:

The stuff that actually impacts user experience – and revenue – but never gets caught in ordinary test suites.

Why This Matters

Performance isn’t a “nice-to-have.”

It’s a direct business driver:

  1. Higher conversions
  2. Lower bounce rates
  3. Higher user trust
  4. Better retention
  5. Cleaner UX
  6. Higher SEO ranking
  7. Less app fatigue and frustration

By treating performance issues as first-class bugs, you’re not just “optimizing”, You’re making your product feel premium and effortless, the way users expect modern webapps to be.