31 posts tagged with "QA"

Quality assurance best practices and insights

View All Tags

QA Bots: A QA Counterpart for Every Team Member, Coordinated by TestChimp

· 12 min read
Nuwan Samarasekera
Founder & CEO, TestChimp

Last updated: 2026-10-07

TL;DR: We shipped QA Bots. Every team member (developer, QA engineer, QA lead, PM) gets their own AI QA bot that handles their share of the QA process in the background: updating requirements from coding-agent chats, writing E2E tests when a feature is done, fixing assigned issues, triaging failing batches, and reporting release health. TestChimp coordinates the swarm: it tracks your QA posture, routes each event to the right person's bot, and keeps an audit trail of what every bot did. Bots propose, people approve. If you want QA to run with agents, mostly in the background while your devs build, this is how we think it should work. Docs: QA Bots · Install and use.


Coding got agents. QA got a longer queue.​

Coding agents changed how fast a team ships. A developer with Cursor or Claude Code can finish in an afternoon what used to take a sprint. QA didn't speed up at the same rate, so the work piles up in the same places it always did, only faster:

Quality responsibilityWhat actually happens
Keep requirements currentDecisions get made in agent chats and meetings; stories and scenarios fall behind
Write tests when the feature is doneThe step most likely to be skipped when the next ticket is waiting
Own the red buildFailures sit until someone notices they're theirs
Run assigned manual checksScenarios wait in a test run nobody opened
Know if the release is healthyFound out in the release meeting, or after it

The common answer is "add an AI testing agent". That helps with one item on the list. It doesn't help with the rest, because these responsibilities aren't one person's job.


QA is a team sport​

Developers own tests for what they build. QA engineers own test runs and failures. Leads own release health. PMs own requirements and the go / no-go call. Every role holds a piece of quality, and every piece slips when that person is heads-down.
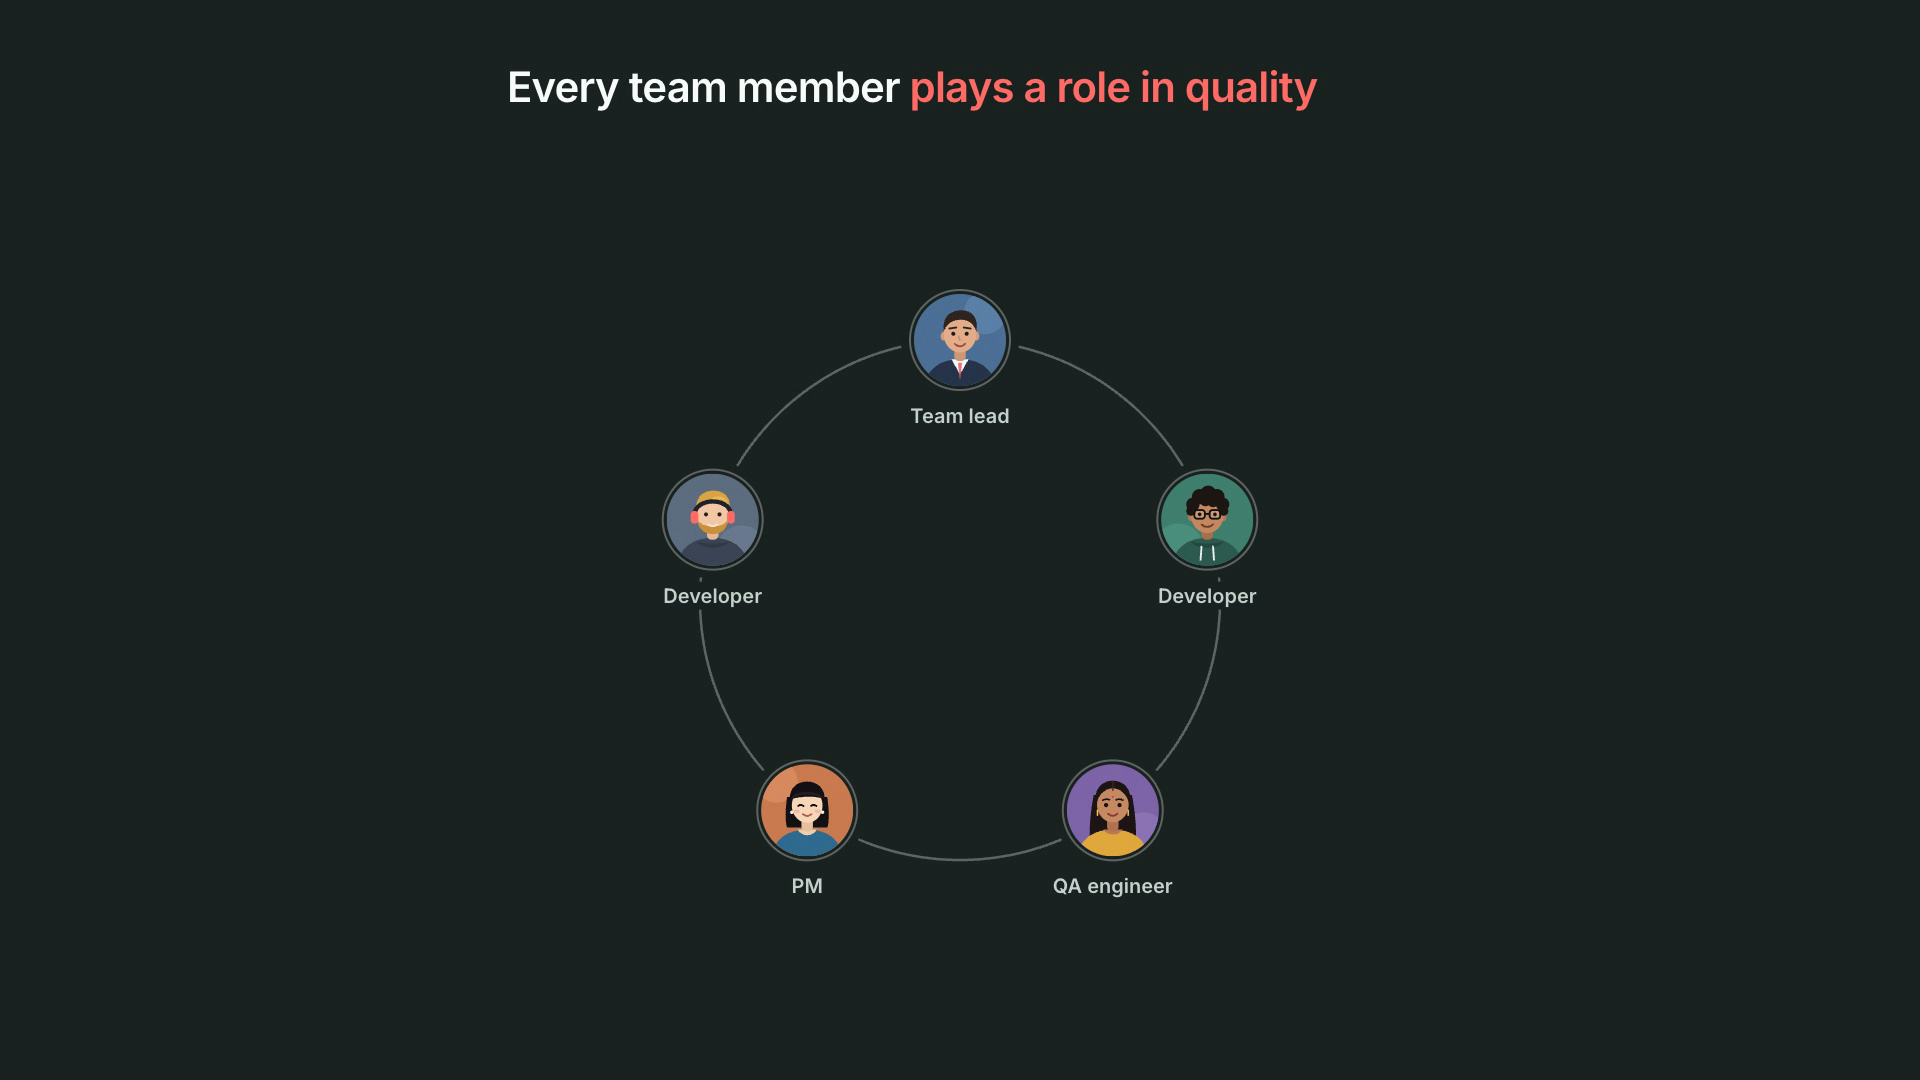
Every team member plays a role in quality: a team lead, two developers, a QA engineer and a PM arranged in a ring

So we stopped asking "what should the QA agent do?" and asked "what would it look like if every role had its own QA agent?"


What are QA Bots?​

A QA bot is an AI agent that acts as one team member's QA counterpart on one project. It receives the events that matter to its owner (their git pushes, the issues and scenarios assigned to them, test batches on their branches, releases), proposes the next QA step, and runs it through a TestChimp workflow once the owner approves.

Each person installs their own bot. During onboarding it asks for their role and pre-selects the work that role usually owns. Together, the bots form a QA swarm that covers the whole team's quality responsibilities.
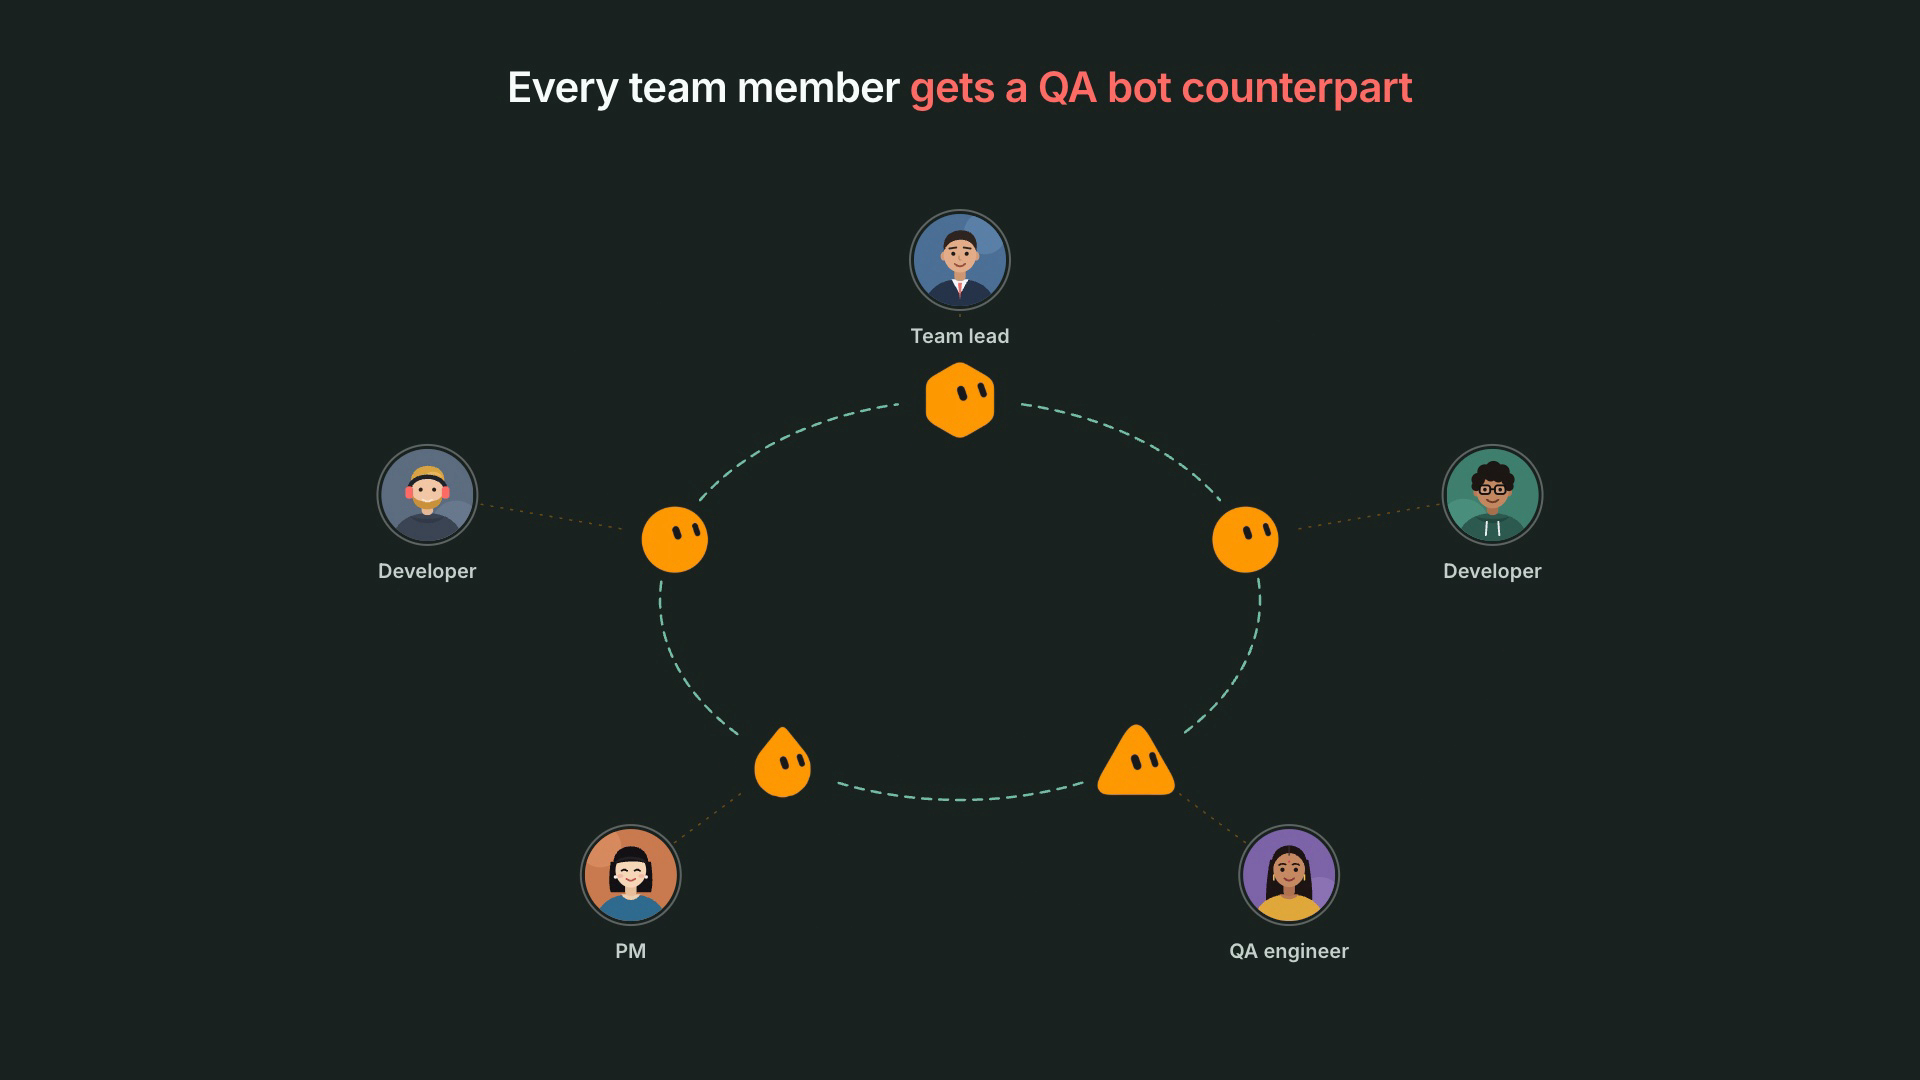
Every team member gets a QA bot counterpart: each person in the ring is paired with their own bot


How does TestChimp coordinate the swarm?​

A swarm of agents without coordination is just more notifications. TestChimp is the coordination layer.

It knows your QA posture. The bots aren't guessing from code. They work from what TestChimp already tracks about your product: requirements as code (stories and scenarios in your repo), API contract coverage, real user behaviour from TrueCoverage, semantic coverage, releases, issues, test executions and verified tests.
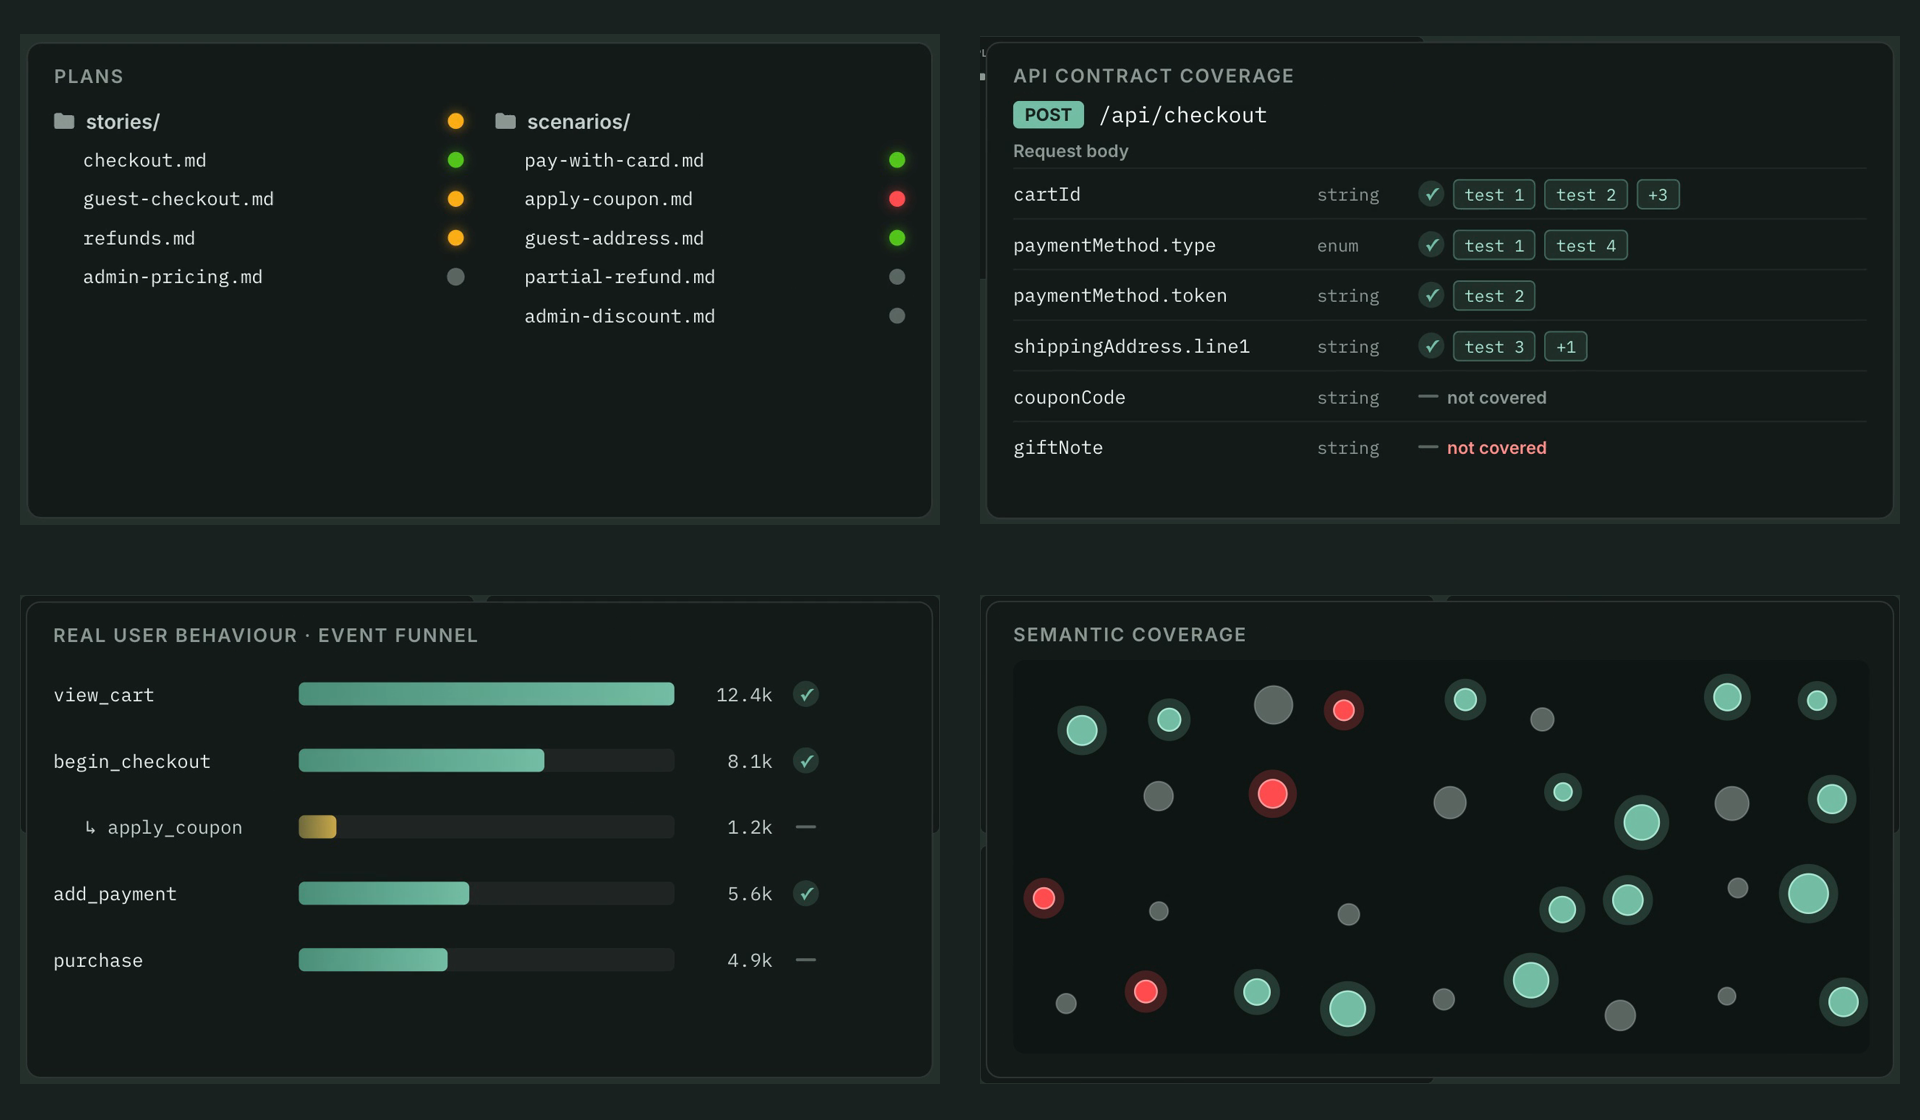
TestChimp QA posture signals: requirement coverage, API contract coverage per field, a real user behaviour funnel, and semantic coverage

It routes every event to the right bot.

  • Your pushes and your assignments go to your bot. Your teammate's bot never sees them.
  • A failed E2E or k6 batch goes to the bot of the latest author on that branch, so two bots never race to fix the same failure.
  • Release events go to every bot subscribed to release health, each tuned to its owner's role.

It keeps delivery sane and auditable. Events are paced (grouped per person and type over a few minutes), queued while a bot is offline, and acknowledged by the bot. Every bot has its own id, and TestChimp records what was sent to which bot and which workflows each bot ran.
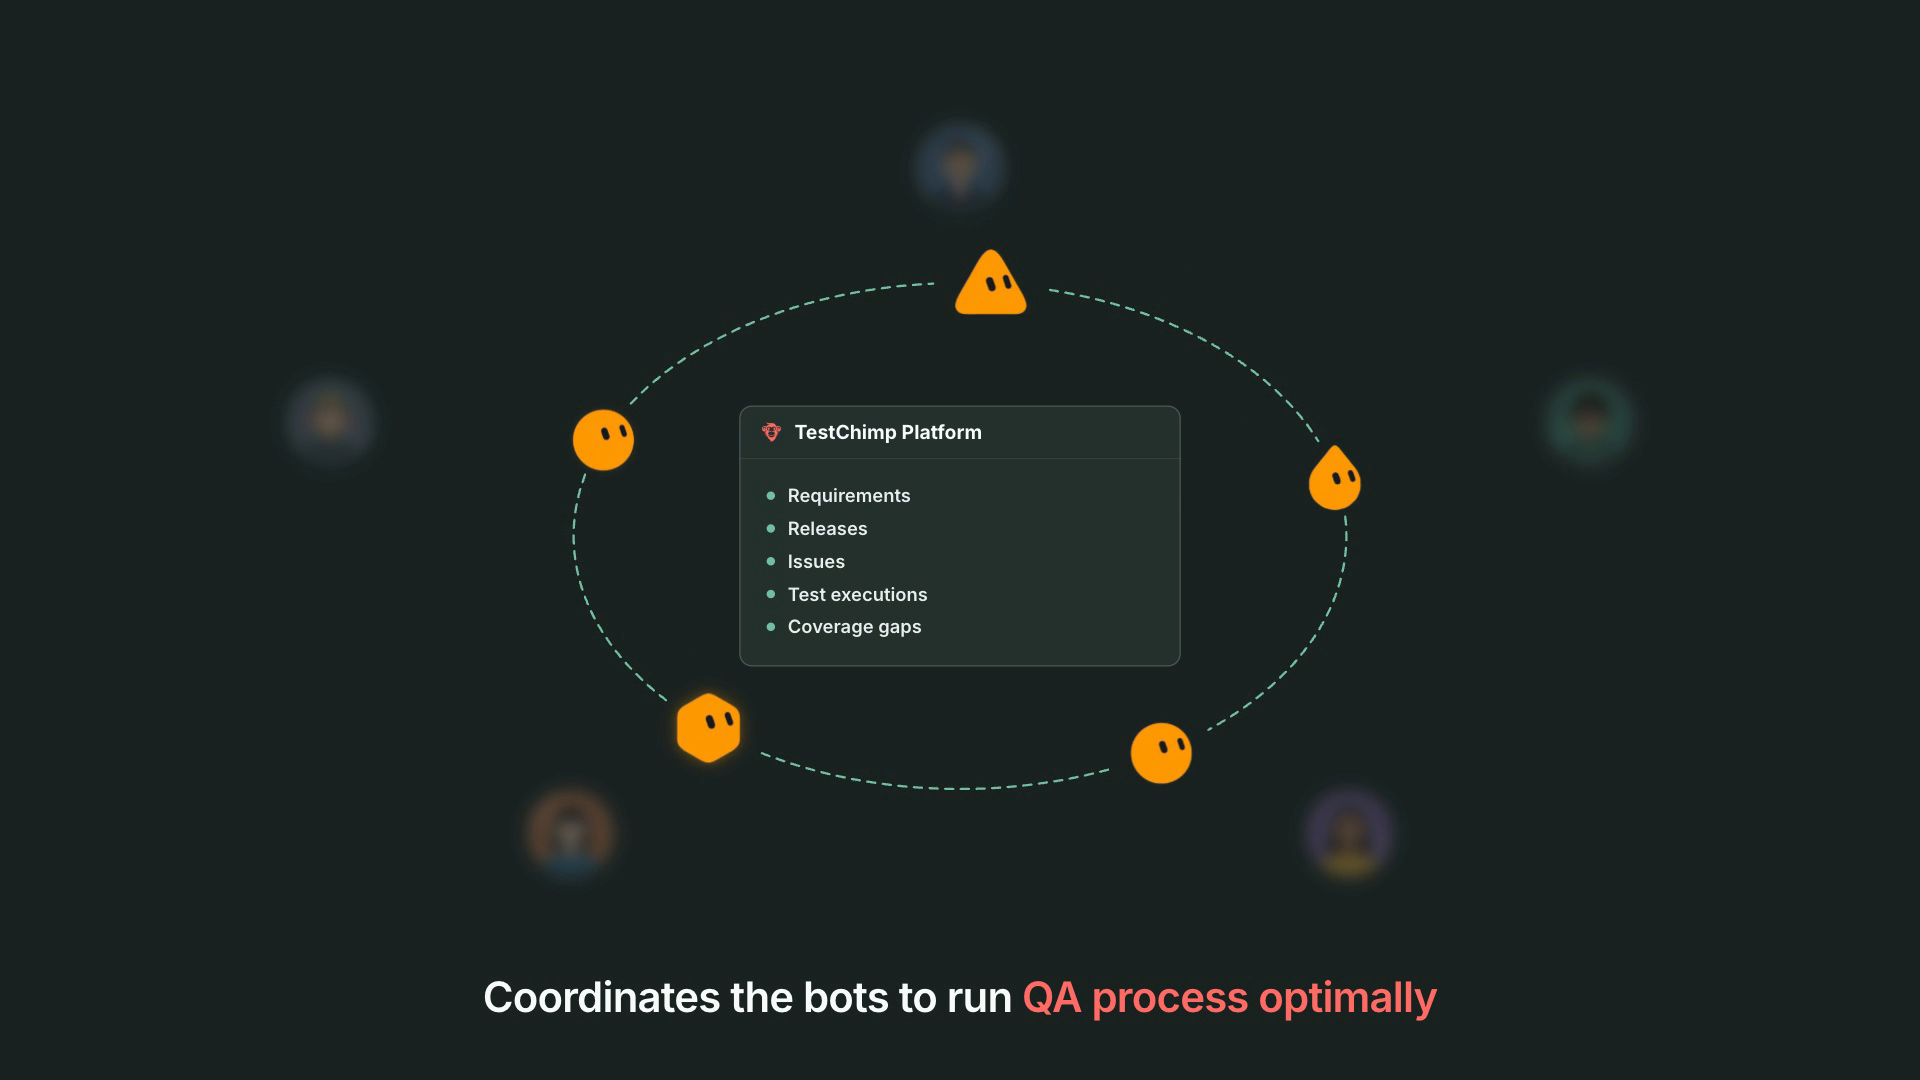
TestChimp coordinates the bots to run the QA process optimally: the bot ring orbits the TestChimp Platform


What does each role's bot do?​

The developer's bot: tests and specs keep up with the code​

You push. The bot reads the commits and judges whether the feature looks done (WIP commits and bursts of pushes mean "wait"). When it does, the bot:

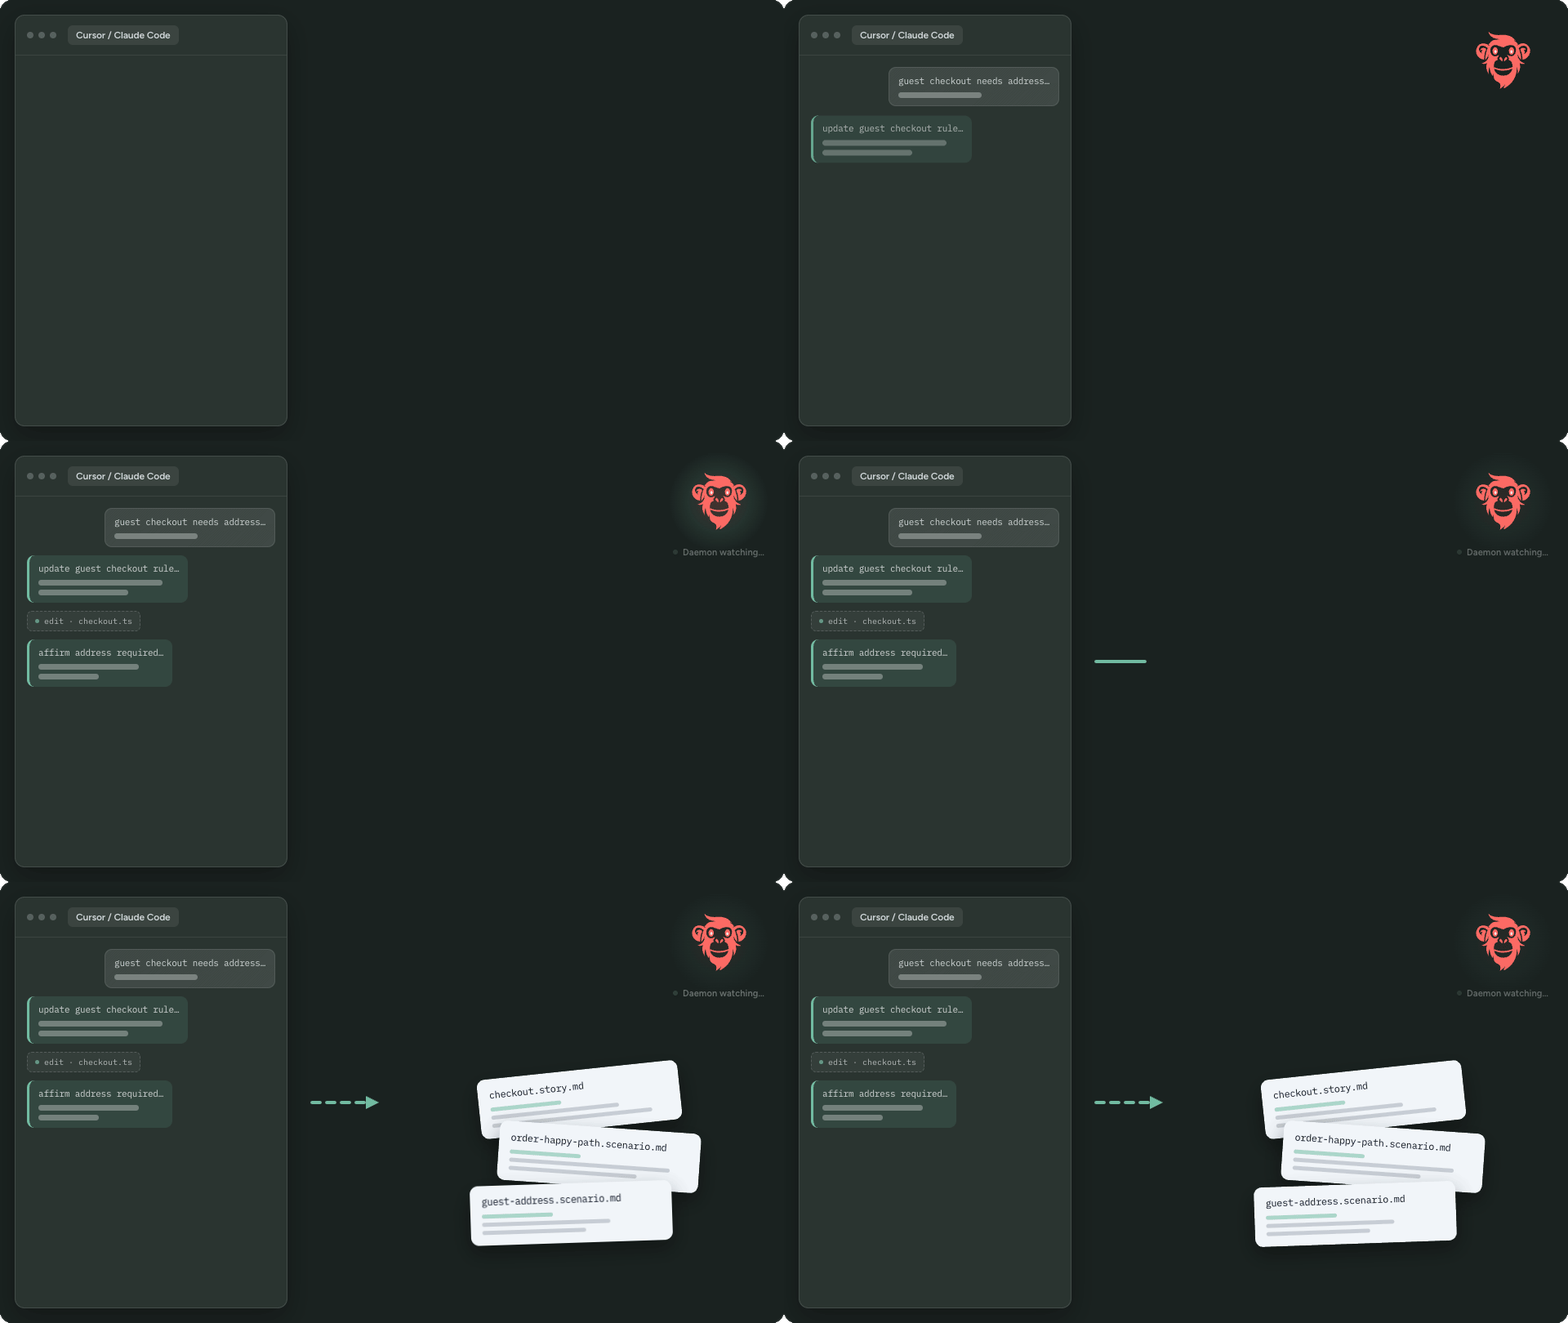
  1. Asks AgentWatch for the requirement changes you decided in your coding-agent chats, and shows you the plan. You approve; the stories and scenarios in your repo update.
  2. Proposes E2E tests for the changed behaviour, tied to those updated scenarios. You say "Go ahead"; it writes them and asks you to verify the runs.
  3. Picks up issues assigned to you with a fix plan.
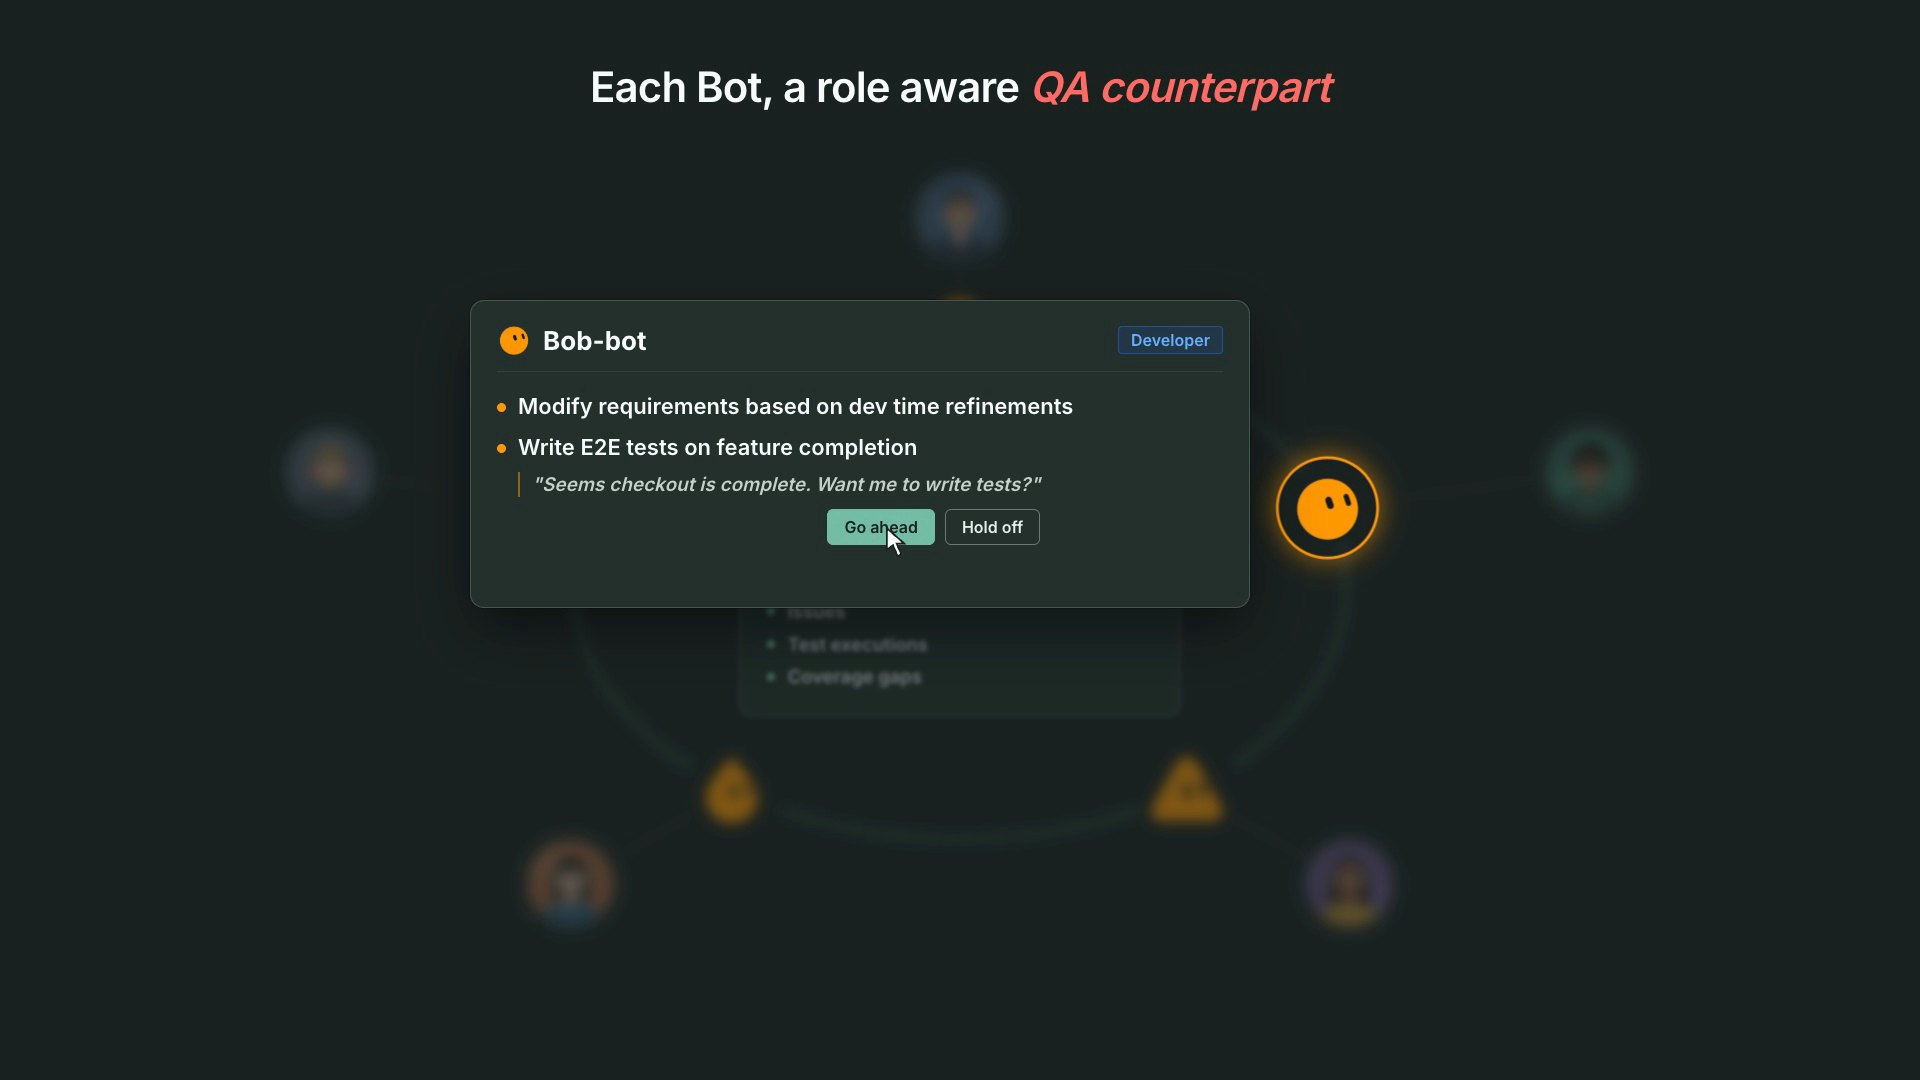
Bob-bot, a developer's QA bot: "Seems checkout is complete. Want me to write tests?" with Go ahead and Hold off

This is the hero flow, and the reason we built QA Bots: requirements updated from how the feature was actually decided, then tests written against them, without the developer stopping to context-switch into QA.

The QA engineer's bot: no more chasing​

Scenarios assigned to you in a test run show up with a link and an offer to walk through them, record results, or automate them. Failing E2E batches on your branches arrive triaged (test needs an update, product bug, or flaky) with a proposed fix. k6 threshold breaches come with a baseline comparison. Turn on requirement updates and it drafts specs from the meetings you were in.
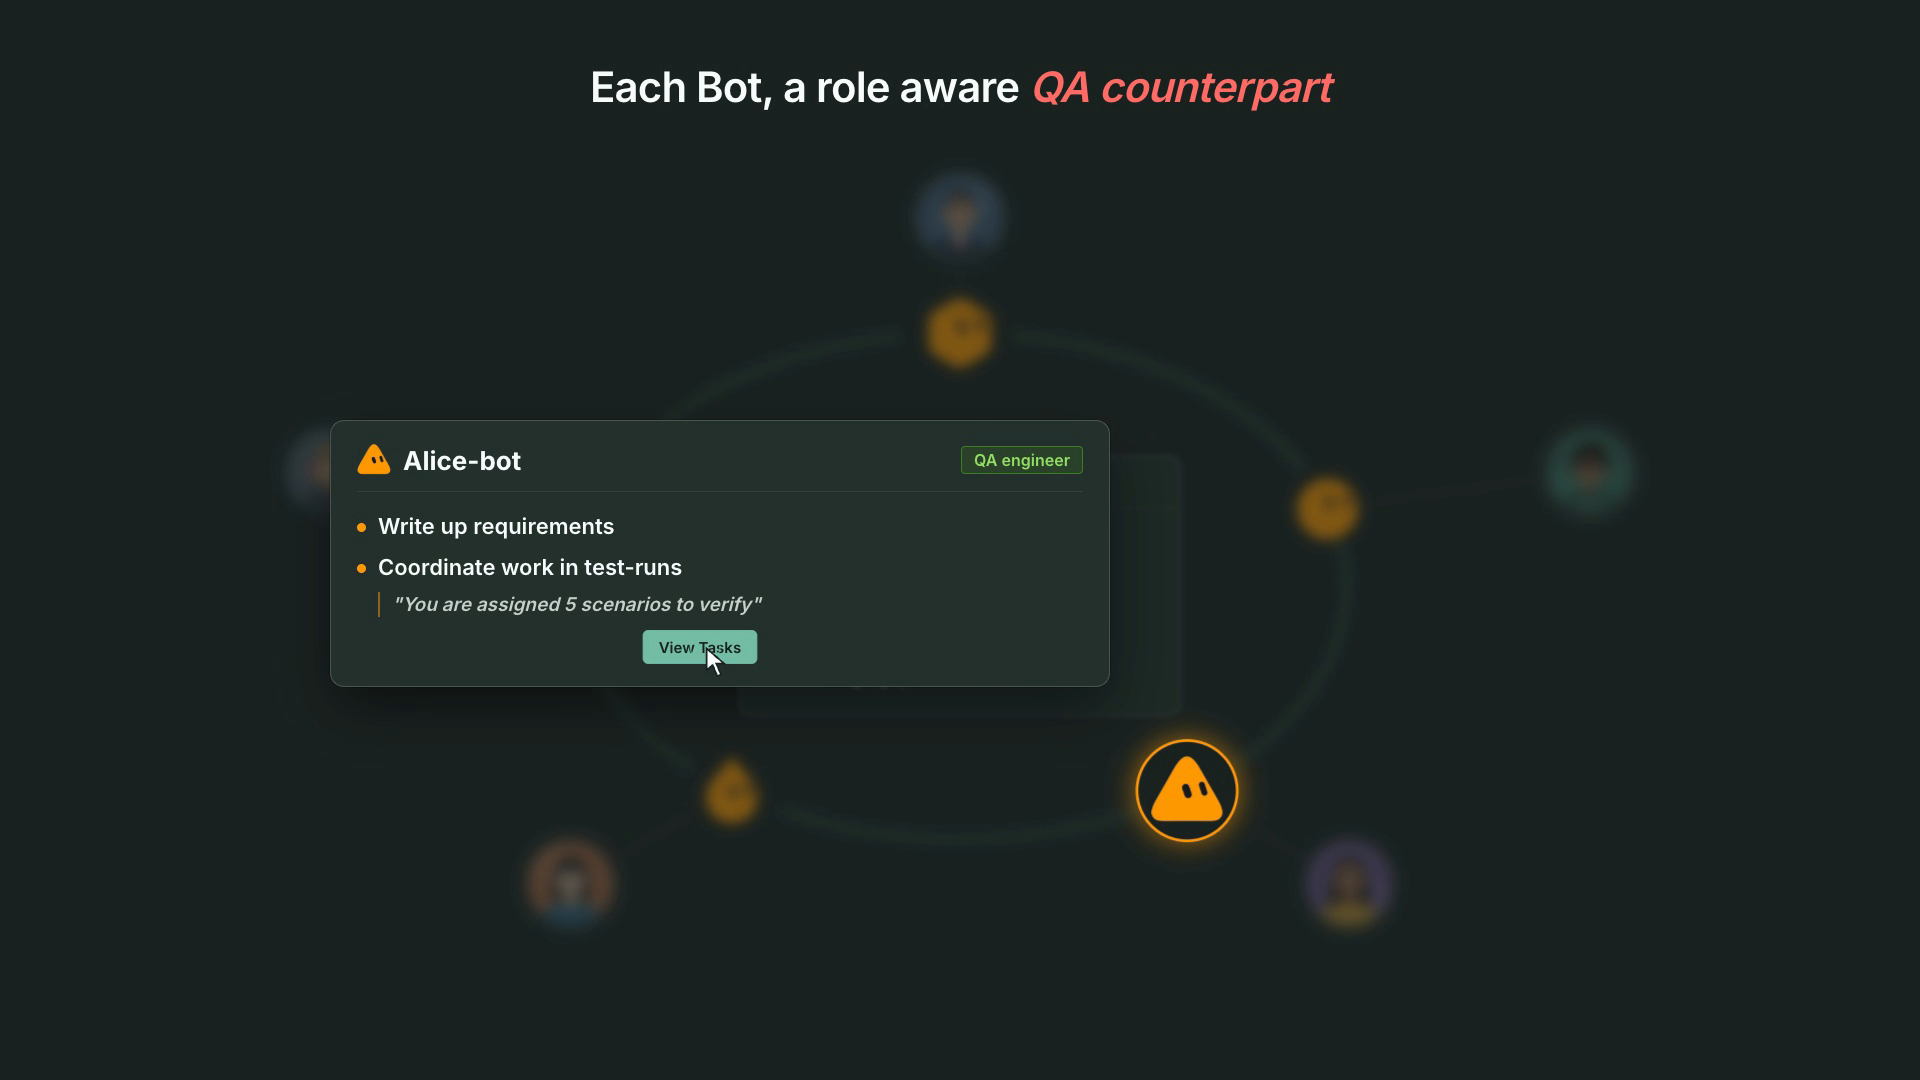
Alice-bot, a QA engineer's QA bot: "You are assigned 5 scenarios to verify" with View Tasks

The QA lead's bot: posture without a status meeting​

When a release is created or changes status, the bot sends a short heads-up: blockers, failing areas, open test runs, tests nobody has verified. Every week it sends a QA posture digest. When a release heads to done with gaps, it offers a release check.
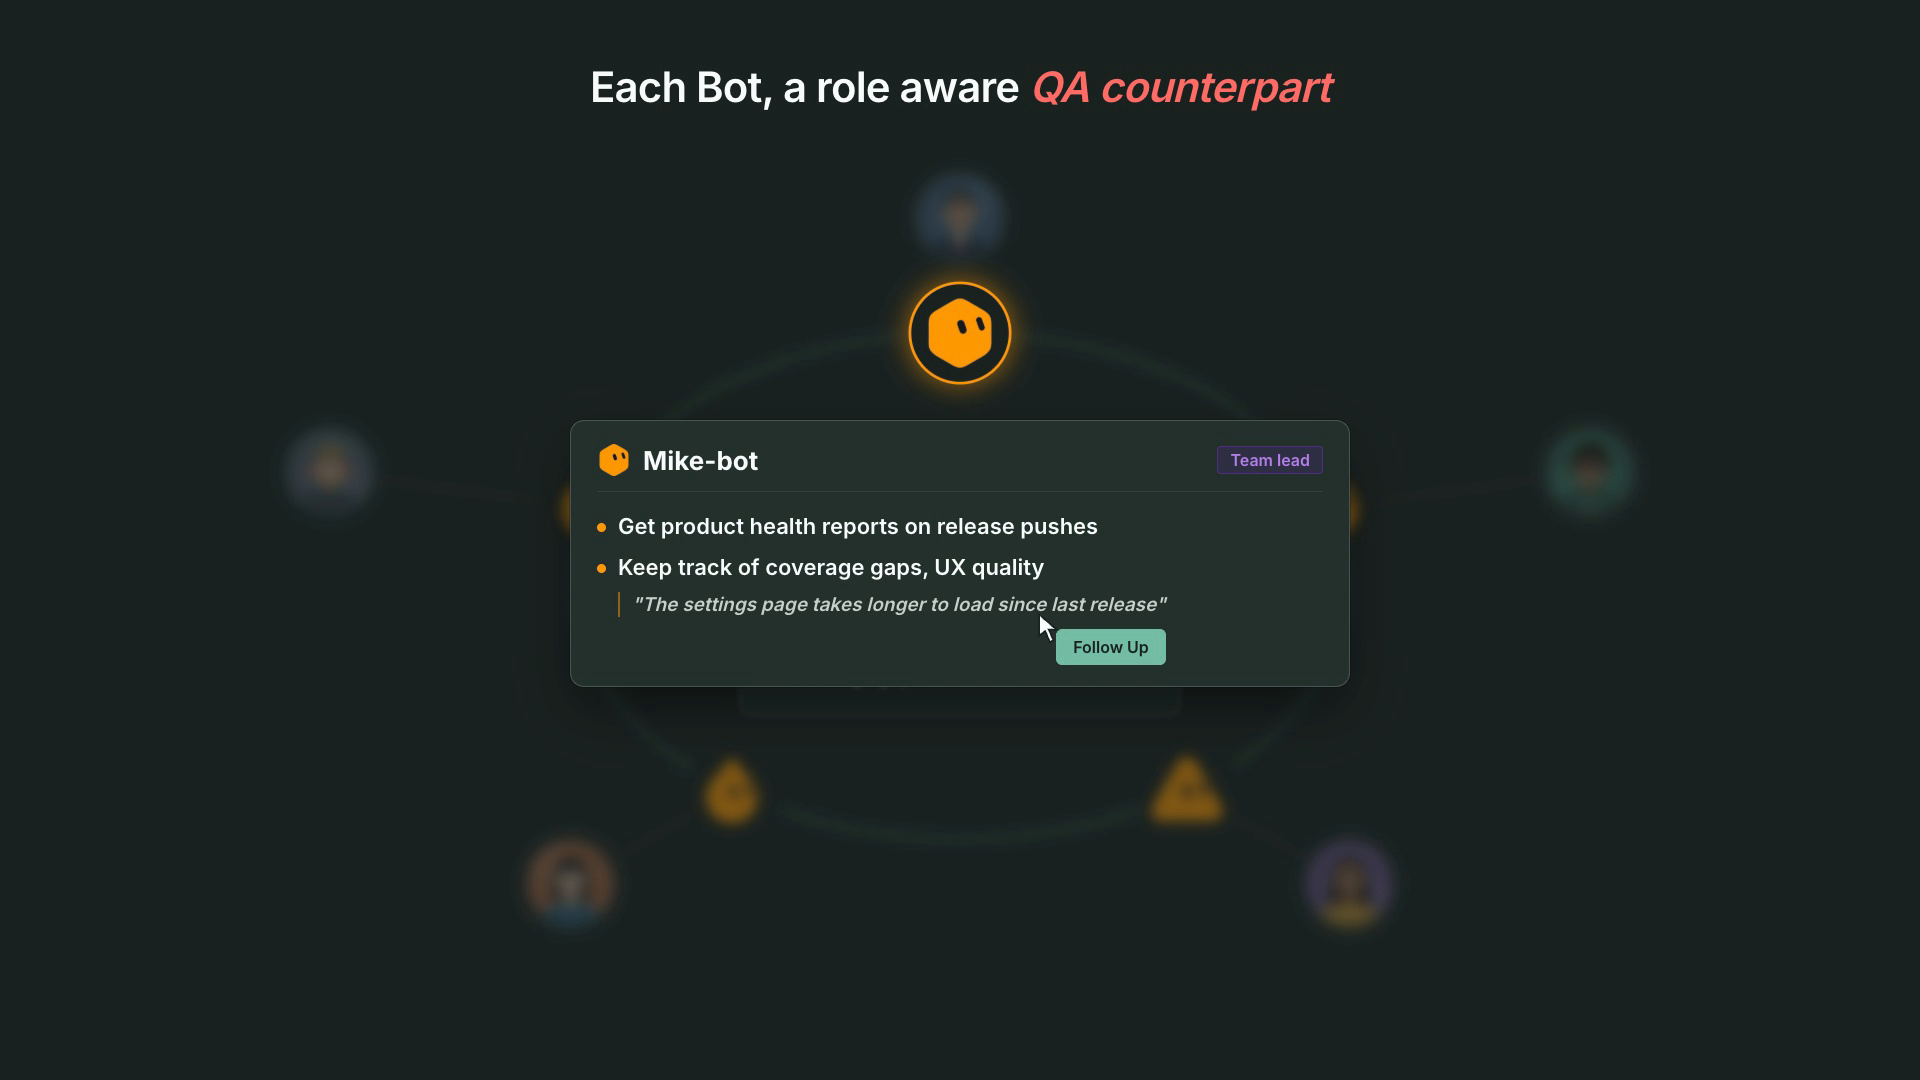
Mike-bot, a team lead's QA bot: product health reports on release pushes and coverage and UX quality tracking

The PM's bot: go / no-go in three lines​

Release heads-ups written for a decision (blocking issues, failing priority scenarios, due date), a weekly health digest, and requirement updates proposed from meeting summaries, so what was agreed in the room becomes a story.


What is the developer experience like?​

The point is that QA happens next to the work, not after it.

You doYour QA bot does
Keep building with your coding agentWatches your pushes and waits until the feature looks done
Approve a requirement-update plan in chatUpdates the stories and scenarios in your repo
Say "Go ahead" on the test proposalWrites E2E tests for your branch, then asks you to verify them
Get assigned a bugShows up with severity, repro and a fix plan
Push a branch that breaks CITriages the failures and proposes the fix
Start your dayGets a short reminder of what's on your plate, or nothing if there isn't anything

No new dashboard to check. No QA ticket queue to babysit. You approve or say "hold off", and the bot takes it from there.


Do QA bots act on their own?​

No, and that's deliberate.

  • Propose, then wait. No story, scenario, test, issue, commit or local command happens without the owner's explicit approval in the conversation.
  • Owner's permissions only. A bot acts as its owner and nobody else. TestChimp's existing access controls apply.
  • Existing workflows, not improvisation. Approved work runs through the same TestChimp workflows your coding agents use (author plans, create tests, fix issue, fix test failures, release check), each with its own plan and report.
  • Your machine stays yours. Local steps (repo mapping, AgentWatch, local test runs) run on your computer only after you grant access, with per-command approval.
  • Pause all from your bot's settings page whenever you want quiet.

Agents do the legwork. People keep the judgment.


Why is this the best way to run QA with agents?​

There are a few ways teams try to put agents on QA today. Here's how they compare:

Coding agent writes its own testsStandalone AI testing agentQA Bots + TestChimp
Who it servesOne developer, in one sessionThe QA teamEvery role: developer, QA engineer, QA lead, PM
What triggers itYou remember to askA scheduled suite or a manual runReal project events: pushes, assignments, failing batches, releases
Knows the requirementsOnly what's in the promptUsually its own test casesStories and scenarios in your repo, kept current from agent chats and meetings
CoordinationNoneOne agent, one queueEvents routed to the right person's bot; one owner per failing branch
Coverage signalsGreen or redIts own reportsRequirement, API contract, real-user (TrueCoverage) and semantic coverage
Who checked the testsThe agent that wrote the codeThe toolA human verifies; Verified Tests record who
Where the work livesYour repo, untrackedThe vendor's platformYour git repo, with traceability and an audit trail

The first column is how most teams start, and it's why green tests stop meaning much. The second fixes testing for one team and leaves the rest of the responsibilities where they were. QA Bots give every role its agent, and TestChimp gives the swarm a shared picture of quality and a way to coordinate.


Why this belongs in TestChimp​

We've argued that skills are SaaS distribution, that Meeting Bots should bring product intelligence into the call, and that AgentWatch should capture decisions where they now happen: in coding-agent chats.

QA Bots are what those pieces were for. The skill and CLI are the workflows each bot runs. AgentWatch and Meeting Bots keep requirements current. Plans as code, coverage, releases and verified tests are the shared picture of quality. And the swarm makes sure every person on the team has an agent working on their part of it.

A QA counterpart for every team member.
A QA counterpart for every team member: the TestChimp bot


Get started​

  1. Make sure your project's one-time setup is done (/testchimp project init). Your bot can walk you through it.
  2. Add the TestChimp QA bot template in Grok.
  3. Ask it to "set up my QA bot", authorize it for your project, and paste its webhook into User Settings → My Bots.
  4. Pick your role. Let it map your local repo and pair AgentWatch if you want requirement updates.
  5. Keep building. Approve the first proposal when it lands. Then get the rest of your team on it.

Full guide: Install and use QA Bots · Overview: QA Bots.


Frequently asked questions​

What is a QA bot in TestChimp?​

An AI agent that acts as one team member's QA counterpart on one TestChimp project. It receives that person's project events (pushes, assigned issues and scenarios, test batch results, releases), proposes the next QA step, and runs a TestChimp workflow after the person approves.

How is a QA swarm different from a single AI testing agent?​

A single agent covers one role's work, usually test execution. A QA swarm gives every team member their own bot, so requirement updates, test authoring, issue fixes, failure triage, manual test coordination and release health are all covered. TestChimp routes each event to the right bot and tracks the shared QA posture.

Do QA bots make changes without approval?​

No. A bot proposes and waits for its owner's explicit approval before any change, test run, commit or local command. Read-only lookups and event acknowledgements are the only things it does without asking.

Which roles get a QA bot?​

Developers, QA engineers, QA leads and product managers. The role you pick pre-selects capabilities: developers get requirement updates, E2E authoring and issue fixes; QA engineers get E2E authoring, test batch fixes and manual test coordination; QA leads get QA posture, batch fixes and manual coordination; PMs get QA posture and requirement updates. You can change any of them.

How do QA bots keep requirements current?​

From two sources. AgentWatch reads your local coding-agent chats and drafts story and scenario updates after a push, and Meeting Bots provide meeting summaries the bot can turn into requirement updates. You approve the plan and the stories and scenarios in your repo update.

Which bot platforms are supported?​

Grok Bot today, installed from the TestChimp template. Dots support is coming soon.

Will my teammates' bots get my events?​

No. Pushes, issues and scenarios go only to the bot of the person they belong to. Failed batches go to the latest author on the branch. Only release events go to every bot subscribed to release health.

Who Checks the Tests Your AI Agent Wrote? The QA Loop and Verified Tests

· 19 min read
Nuwan Samarasekera
Founder & CEO, TestChimp

Last updated: 2026-09-30

TL;DR: When an AI agent writes the code and the tests, green proves little, because the agent is checking its own work. TestChimp runs the QA process as a feedback loop: it surfaces product risks and coverage gaps, agents work through them, and results flow back in. Governance signals (Verified Tests, TrueCoverage, semantic coverage and API contract coverage) show what is actually covered and who verified it. Meet-Bots and AgentWatch keep requirements current, so tests are written against up-to-date intent.

Why do agent-written green tests prove nothing?​

Because the agent grades its own work. If the model misreads a ticket, its tests misread it the same way, and the suite stays green while the product does the wrong thing. Practitioners describe this as the agent "marking its own homework".

Three failure modes show up once agents write both sides (they are described in the Verified Tests announcement):

Failure modeWhat goes wrong
Linked is not provenThe test is tagged to a scenario but never asserts the expected outcome
Happy-path impersonationA green run for a neighbouring flow is counted as coverage of the hard one
Unowned claimsCoverage says "covered", and nobody can say who looked at the script

Green is an execution fact. A scenario link is a mapping. Neither tells you that anyone checked whether the test verifies the behaviour. Before agents, "who wrote this test?" was a workable stand-in for "who checked it?". With agents writing tests at speed, that stand-in no longer holds.

The answer has three parts: a QA loop that keeps agents working on the real risks, governance signals that show what is covered and who verified it, and requirements that stay current so tests are aimed at the right target.

How does TestChimp run the QA loop?​

TestChimp is a QA workflow layer for agents. Per the docs, it orchestrates a tight feedback loop so coding agents such as Claude continuously understand product risk, coverage gaps and where users actually spend time, and then act on them. Humans stay in control of intent (what the product should do), and agents do the execution and upkeep against that intent.

In practice the loop looks like this:

  1. Plans live in your repo. Stories and scenarios are markdown files in a mapped plans/ folder. Plans and tests sync both ways between TestChimp and your repo, and changes arrive as pull requests or merge requests you review.
  2. Per PR, run QA. The /testchimp run QA workflow chains plan, environment, SmartTest and smoke steps, with optional exploratory and TrueCoverage steps, under one scope.
  3. In CI, results are reported back. The @testchimp/playwright plugin reports runs and traces to TestChimp and tags user events with test identity for TrueCoverage.
  4. On a cadence, upkeep. /testchimp upkeep closes coverage gaps found from requirements and TrueCoverage, explores high-signal paths and cleans up.

The web app (or TestChimp Studio on the desktop) is the control plane where the risk list is visible: uncovered scenarios, coverage gaps, bugs found by exploration and workflow executions. Details: What is TestChimp? and Upkeep.

Green run alone vs green run with governance signals​

Green run on its ownWith governance signals
What it tells youThe tests that exist passedWhich scenarios, API operations and user events are covered, and by which tests
What a coverage report countsTestsScenarios with linked tests, API operations and schema fields exercised, production events seen in test runs
Who looked at the testUnknownA Verified Tests badge shows who inspected it
Near-duplicate testsLook like extra coverageSurfaced by the semantic graph
GapsFound by accidentListed and actionable: uncovered scenarios, uncovered API operations, production events with no test coverage

The next sections cover each signal.

What is a Verified Test?​

A verified test in TestChimp is a SmartTest a project member has inspected and confirmed actually covers a linked scenario, not merely that it ran green or is annotated.

(A SmartTest is a standard Playwright test in your repo with scenario links added.) To verify one, a reviewer opens a test execution, looks at the screen captures and steps from the run, reads the test code with View Test, and then uses the check badge next to the test name. Status is stored in TestChimp, not in the Playwright source, so agents keep authoring tests while humans record that they inspected them.

The badge has three states on a test:

  • Hollow: none of the linked scenarios are verified.
  • Grey: some, but not all, linked scenarios are verified.
  • Blue: every linked scenario for that test is verified.

On coverage views, each scenario shows a filled badge when a covering test has been verified, a hollow badge when tests exist but nobody has inspected them, and no badge when there are no linked tests. Hovering a verified badge shows who verified it. Un-verifying is recorded as "manually unverified", so the audit trail stays.

Two honest details matter for governance:

  • Stale markers. A blue badge with a red "!" means the test was verified, but an agent later patched it. By default, when an agent reports a fix to an existing test, the badge goes stale until someone re-verifies it. This can be changed in project settings.
  • Inspection is deliberate. Clicking the coverage-side badge does not verify anything. It points you to the execution viewer, so verification stays an inspection action and not a bulk paint on a dashboard.

Details: Verified Tests and Link tests to scenarios.

What other signals show what is actually covered?​

Verified Tests answer "did a person check this test?". Three more signals answer "what is covered at all?":

  • API contract coverage (API schema coverage). Connect your OpenAPI specs from git, run SmartTests with API capture enabled, and TestChimp shows per-operation coverage plus request, query and response field and response-code coverage. Traffic that hits paths or fields the spec never declared is marked as undocumented. Each gap can become an issue, a create-tests prompt for your agent, or a deliberate ignore. See API contract governance.
  • TrueCoverage. The same user-event taxonomy is overlaid from production (via RUM SDKs) and from test runs, so you see which real user pathways have no test coverage, with metrics such as demand, duration, drop-off and depth. See TrueCoverage.
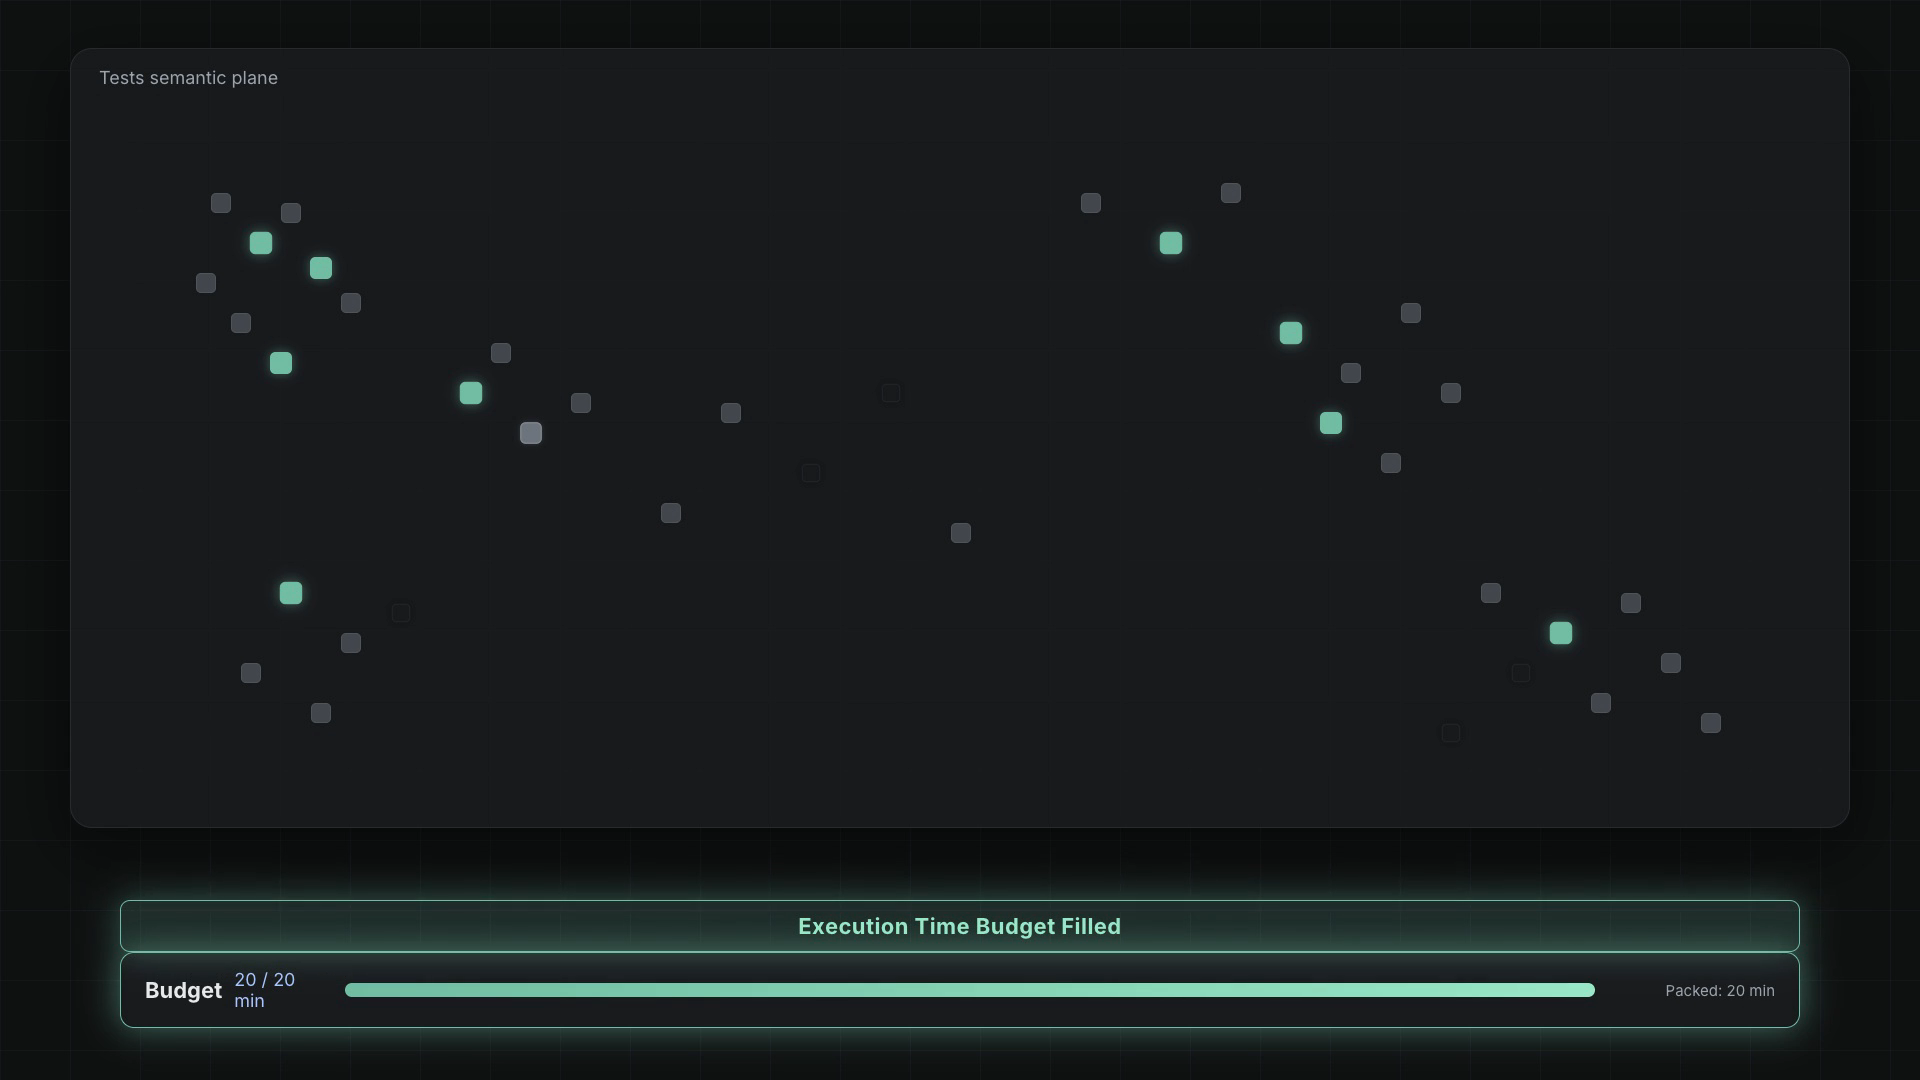
  • Semantic coverage. Stories, scenarios, SmartTests, issues and TrueCoverage events are placed in one embedding space in the Semantic Canvas, so you can see what is close in meaning, whether it has a linked test, and which tests are near-duplicates. See Semantic Canvas.

Together with requirement coverage (next sections), these show where coverage is real, where it is thin, and where it is duplicated.

How do requirements stay current? (Meet-Bots, AgentWatch)​

Tests can only be aimed at the right target if the requirements do not rot. Much of what a team knows is decided out loud or in chat, then never written down. Meet-Bots and AgentWatch keep the QA surface current from the two places those decisions now happen, so the tests agents write are written against up-to-date requirements:

  • Meet-Bots join Google Meet, Zoom, Microsoft Teams and Webex calls, transcribe once, and keep the meeting notes as tribal knowledge. After the call, the transcript can be handed to a workflow that drafts user stories and scenarios from what the team agreed. Team members can also @mention the bot for answers grounded in the stories, scenarios and test results. See Meet-Bots and Meetings, PII, and follow-ups.
  • AgentWatch (in TestChimp Studio) watches local coding-agent sessions such as Cursor and Claude Code, spots when business rules or UX expectations were decided in chat, and proposes story and scenario updates. You review and approve the proposed plan, the plans/ folder updates, and you raise a PR. See AgentWatch and Enable and configure AgentWatch.

Both mechanisms propose; people approve. Stories and scenarios are markdown files with frontmatter in your Git repo (see Requirement planning), and plans sync both ways between TestChimp and the repo, so every requirement change is a reviewable diff. The tests are then authored and maintained against those scenarios, for example by the create-tests workflow, which writes tests for requirements or API coverage gaps. See Author plans and Create tests.

How does traceability connect tests to scenarios?​

Traceability is code-native. A test declares which scenario it covers with a Playwright annotation on the test:

test('successful login', {
annotation: [{ type: 'scenario', description: '#TS-101' }],
}, async ({ page }) => {
// ...
});

TestChimp links the test to the scenario by its #TS-<n> ordinal and tracks execution results from CI runs (via the @testchimp/playwright reporter). One test can list several scenarios. In Test Planning, the Insights tab shows requirement coverage for any folder, filterable by environment, release and time range, including scenarios with no linked tests, scenarios with no recent executions, and failing scenarios. Renaming a scenario does not reset verification as long as its ordinal stays the same; linking a different scenario is a new claim and starts unverified.

Put together, the chain is: scenario (kept current) -> linked test -> execution -> human verification. Each link is visible, and the last one has a named person and a time.

Details: Requirement traceability and Traditional traceability vs TestChimp.

What should a team review before release?​

A short checklist that maps to what the platform shows:

  1. Uncovered scenarios. Any high-priority scenario with no linked test (Insights, Requirement Coverage, filtered to the release scope).
  2. Failing or unexecuted scenarios. Scenarios that have tests but no recent execution, or whose latest run is red.
  3. Hollow badges. Scenarios with tests that nobody has inspected. Decide which ones need a human look before this release.
  4. Stale badges. Tests verified earlier that an agent has since patched.
  5. API and user-behaviour gaps. Uncovered API operations or fields, and production events with no test coverage in TrueCoverage.
  6. Requirement drift. Pending AgentWatch plans or meeting follow-ups that have not been reviewed yet, so the scenarios may not reflect what was decided.
  7. Release evidence. The release view brings together test runs, requirement coverage, ExploreChimp findings and release checks; a gate can also be queried programmatically with an API key.

See Release management, Release intelligence and Programmatic release gating.

What does this not solve?​

  • Verification is a human sanity check, not a proof of correctness. A reviewer can still approve a weak test.
  • The loop assumes the scenarios are right. TestChimp helps keep them current and can score their quality (see Requirement quality governance), but a wrong requirement stays wrong until someone notices.
  • Capture depends on the team using the bots and enabling AgentWatch. Decisions made outside meetings and agent sessions are not seen.
  • Coverage signals depend on setup: API capture is off by default, and TrueCoverage needs the RUM SDK instrumented in your app.

Frequently asked questions​

How do I trust tests written by an AI agent?​

Do not rely on a green run alone. Look at what is actually covered (linked scenarios, API contract coverage, TrueCoverage, semantic coverage), and have a person inspect the run and the code and record that the test verifies the scenario.

Who should review AI-generated tests?​

A project member who can judge the requirement, such as a QA lead or the engineer who owns the feature. In TestChimp they open the test execution, inspect the screen captures, steps and code, and mark the test as verified.

Is a passing test the same as a verified test?​

No. A passing test is an execution fact, and a scenario link is a coverage claim, while a verified test has been inspected by a person who confirmed it covers the linked scenario.

What happens to the Verified badge when an agent edits the test later?​

By default the badge shows a stale marker when an agent reports a fix to the test, so someone can re-verify it. Teams can change this in project settings.

What does TestChimp do beyond verifying tests?​

It runs the QA loop: it orchestrates a feedback loop so agents keep seeing product risk and coverage gaps and act on them, while people own intent. Meet-Bots and AgentWatch keep requirements current, so tests are written against up-to-date requirements.

What coverage signals does TestChimp show for AI-written tests?​

Requirement coverage by folder, environment, release and time range; API contract coverage for OpenAPI operations and fields; TrueCoverage for production user events versus test runs; and semantic coverage through the Semantic Canvas. Verified Tests adds who inspected each test.

AgentWatch: Capture Tribal Knowledge from Coding-Agent Chats

· 6 min read
Nuwan Samarasekera
Founder & CEO, TestChimp

TL;DR: We shipped AgentWatch in TestChimp Studio—it watches local coding-agent chats (Cursor, Claude Code, Codex, and 20+ others), spots when business rules, UX expectations, or constraints get decided, and proposes story/scenario updates so your QA surface evolves with development across the whole team. Filtering at scale uses Jev plus our semantic embedding neighbours; you approve a plan and raise a PR. Docs: AgentWatch · How to.

AgentWatch watches coding-agent chats and keeps stories and scenarios current


The tribal knowledge problem did not go away​

Tribal knowledge—the discussion with a colleague over coffee—was often the hardest part of the SDLC to capture. Specs, tickets, and test plans lag behind what the team actually agreed.

Whether you like it or not, with the transition to agents those conversations have been repeated almost verbatim with coding agents: same product rules, same UX expectations, same edge-case constraints—usually a bit better filtered. That makes agent threads a near-perfect capture point for the knowledge that used to evaporate in hallways.

Meeting tools still miss the desk. Meeting Bots capture what is said in the call. AgentWatch captures what is decided while you build.


What AgentWatch does​

AgentWatch watches your agent interactions and identifies when:

  • new business rules are decided
  • UX expectations are finalized
  • finer-grained constraints get defined

…then proposes updates to user stories, and adds or updates scenarios—so your QA surface stays aligned with product reality across all your developers, not only the person who had the chat.

Core loop:

  1. Work normally in your coding agent
  2. Studio’s watch daemon indexes sessions for mapped projects
  3. On cadence, high-signal decisions are filtered and batched
  4. You get a plan → approve → stories/scenarios update → raise a PR
  5. Downstream QA workflows course-correct from the updated surface

Full product walkthrough: AgentWatch docs. Setup: How to enable.


Why this became feasible now: Jev as the filter​

Agent conversations are verbose. Most chunks are tooling noise, not durable product guidance—requirements, expectations, acceptance-worthy constraints.

That is an awkward job for a full LLM on every chunk, for every developer, all day. It is a natural job for Jev—TypeSafe’s System One model built to answer typed decision questions with calibrated scores, not to write essays. Talk about timing: AgentWatch needs high-volume, low-latency “is this product-relevant?” judgments. Jev fits.

One practical limit of Jev is the tighter context window (~32K for state + the longest question). Stuffing all stories and scenarios into every classify call is infeasible. This is where TestChimp’s shared-space semantic embedding canvas earns its keep:

  1. Query the closest story / scenario neighbours to the conversation chunk (Semantic Canvas is how humans explore that same space)
  2. Feed those neighbours—plus chat summary and chunk—to Jev
  3. Jev scores likelihood of impact per related story/scenario, and whether a new story should be authored
  4. Only the filtered hits go to an LLM to suggest updates and draft new stories
  5. You get a PR-shaped plan; you confirm; QA workflows follow

Jev is a means. The product is AgentWatch: tribal knowledge → governed QA surface.


Where AgentWatch sits among agent-history tools​

A wave of local tools now index coding-agent sessions so you can search or recall past threads—useful when you ask “what did we decide about auth last month?” Examples people already search for:

  • AgentsView — multi-agent session browser / index (AgentWatch uses it as the watch layer)
  • aise — ultra-fast local session search + MCP
  • Callimachus — hybrid keyword + semantic recall over agent history
  • Prism — persistent session memory and knowledge graph for agents

Those tools help you find the thread. AgentWatch’s bet is different: when a decision should change what QA monitors, it should land in stories and scenarios—versioned, reviewable, and wired into the same workflows and QA Brain you already run—not stay buried in a searchable chat archive.


The DevX we optimized for​

No new ritual. No “paste this transcript into TestChimp.”

You doAgentWatch does
Enable once in Settings → AgentWatchRuns AgentsView, maps sessions to projects
Keep coding in Cursor / Claude Code / Codex / …Filters on cadence; prefers false negatives over spam
Approve the plan when notifiedUpdates plans/ stories and scenarios
Raise the PRDownstream QA posture stays current

Configure cadence, which agents to watch, and whether add/update is allowed for stories and scenarios—details in the how-to.


Why this belongs in TestChimp​

We already argued that skills are SaaS distribution, that Studio collapses the stitching tax on the desktop, and that Meeting Bots put product intelligence in the call.

Agent chats were the remaining tribal channel: rich decisions, thin structured memory, specs that lag the product.

AgentWatch closes that channel—so the hours your team already spends directing agents become fuel for a living QA surface, not another forgotten scrollback.


Get started​

  1. Install TestChimp Studio and map a local folder to your project.
  2. Open Settings → AgentWatch → enable.
  3. Import or bootstrap a QA baseline if you do not have one yet.
  4. Keep working in your agents. Review the first plan when it lands. Raise the PR.

Docs: AgentWatch · How to configure · Semantic Canvas · Meeting Bots.


Frequently asked questions​

Which agents are supported?
Cursor, Claude Code, Codex, and 20+ others via the pinned AgentsView provider set. Pick which ones to watch in Settings.

Does every chat create a plan?
No. Jev filters for decided, verifiable product guidance. Implementation chatter is ignored by design.

Do I need a baseline first?
Yes for day-to-day sync—roughly ≥ 10 stories or ≥ 20 scenarios—or bootstrap / import first. See baseline.

Is this the same as searching my agent history?
No. Search tools help you recall threads. AgentWatch proposes governed updates to the QA surface your team shares.

Meeting Bots: Bring Product Intelligence Into the Call

· 7 min read
Nuwan Samarasekera
Founder & CEO, TestChimp

TL;DR: We shipped Meeting Bots—TestChimp agents that join your Meet / Zoom / Teams / Webex calls with the complete product context and QA posture already built about your SDLC. One cloud join captures tribal knowledge (organized transcripts you retain and feed into workflows), teammates @testchimp / @BotName for product-aware answers—not a blank LLM—and you can assign work live, then hand the transcript to ChimpHands to turn conversations into QA workflows (stories, scenarios, tests). Use cases go beyond QA—pre-sales, support, FDE—via custom bots with bespoke personalities. Docs: Meeting Bots.

Google MeetZoomMicrosoft TeamsWebex

The note-taker gap​

Meeting tools got good at recording. They did not get good at knowing your product—or at keeping what the team said from evaporating after the call.

What the team needsWhat a generic meeting bot does
“Codify what we just decided so it isn’t tribal forever”Leaves a recording someone may never re-open
“Do we already cover this scenario?”Summarizes the last ten minutes of talk
“File the flaky auth bug we just reproduced”Dumps a bullet list into Slack
“Turn this agreement into stories”Leaves a transcript for someone else to rewrite
“Help on a pre-sales / support / FDE call with product truth”One personality, no product graph

If you already run TestChimp, the expensive part is done: plans as code, coverage, issues, releases, knowledge bases, observability, API schemas, QA Brain. The meeting was the last place that context stayed outside the room—and the last place team knowledge got said once and lost.

Meeting Bots close that gap.


What Meeting Bots are​

A Meeting Bot is not a second product. It is a way for TestChimp Agent to sit in the call with the same control plane your agents and humans already use.

Core loop:

  1. Capture tribal knowledge — detailed notes organized and retained in cloud; optional PII redaction + summarize; knowledge can be fed into later workflows
  2. Ask in-call — @testchimp or @QABot (or just ask for help) answers with product / SDLC context
  3. Assign — capture tasks and issues from the discussion, not from post-hoc archaeology
  4. Follow up — after the call, turn the conversation into workflows (author the stories and scenarios you just agreed, scope tests, file issues)

Concepts (full walkthrough in docs):

ConceptRole
BotsPersonalities (job role + policy)—QABot, SalesBot, or custom
MeetingsJoined calls + transcripts (your retained tribal knowledge)
CalendarsGoogle / Outlook so upcoming joins and @mentions work cleanly

Capture tribal knowledge​

Alignment that lives only in the room dies when the call ends. Meeting Bots treat the conversation as first-class product memory: transcripts are organized, retained, and available for redact / summarize and for agent handoff—so what your team shares can be captured, codified, and reused, not trapped in chat scrollback or someone’s private notes.

That is the foundation for everything else: live answers, task assignment, and post-meeting workflows all consume the same durable meeting context.


One join, many personalities​

Here is the part people get wrong about “AI in meetings”: they assume every personality means another recorder and another bill.

In TestChimp, one visible agent joins and one transcript is produced for the meeting. You can still attach multiple custom bots—FDE assist, PM critique, pre-sales, support—and @mention the right lens. Transcription is per meeting, not per bot. Adding three personalities does not triple the join meter.

Policy files live where the rest of your agent governance lives:

plans/knowledge/policies/meetbots/<BotName>.policy.md

Version them. Review them. Treat brainstorming agents like any other playbook—not a one-off system prompt someone typed into a vendor dashboard.

Billing stays boring on purpose: $1 / hour of join time, plus ChimpHands credits when you actually invoke the LLM (@testchimp / @BotName, or transcript PII / summarize processing). Passive transcription does not burn credits every spoken second. Details: Billing.


Beyond QA​

The use cases go well beyond QA.

TestChimp already has deep product-context awareness across user stories, scenarios, tests, executions, releases, KBs, issues, observability metrics, API schemas, and more. Meeting Bots put an assistant with that context into the conversation—ready when needed.

Imagine that assistant in:

  • Pre-sales calls — product truth without improvising capabilities you do not have
  • Customer support conversations — grounded in real issues, releases, and scenarios
  • FDE interactions — implementation help against plans and APIs, not vibes

Define custom bots with bespoke personalities and objectives, then bring the right assistant(s) into each meeting. Docs: Custom bots.


Post-meeting is where the loop compounds​

Live answers are useful. Governed follow-through is the unlock—especially for QA workflows built from what the team agreed.

From a meeting detail page you hand the transcript to ChimpHands with a draft like:

/testchimp referring the meeting <id> as context, do the following :
author user stories for the behaviour we agreed, with scenarios

Same catalog workflows you already run for author-plans, fix-issue, upkeep—except the meeting is first-class context instead of a forgotten Google Doc.

That is the difference between “we recorded the alignment” and “the alignment became stories, scenarios, and tests in the repo.”


Why this belongs in TestChimp​

We have argued that skills are SaaS distribution, that automations close the routing gap, and that Studio collapses the stitching tax on the desktop.

Meetings were still a parallel universe: rich talk, thin product memory, tribal knowledge that never got written down.

Meeting Bots put product intelligence in the call—so the hour you already spend aligning becomes fuel for delivery, support, and sales loops, not another artifact to reconcile later.

Your meetings—now part of your product intelligence.


Get started​

  1. Open Meeting Bots in the app (capability on eligible plans).
  2. Connect a calendar.
  3. Join with QABot (or create a custom personality for sales, support, or FDE).
  4. @testchimp a product question mid-call.
  5. Afterward, open the meeting → ChimpHands → turn the agreement into work.

Full product docs: Meeting Bots · Custom bots · Meetings & PII · Billing.


Frequently asked questions​

Do I need a calendar?
Strongly recommended. Calendar-linked joins improve upcoming-event pickers and team @mention guards when participant emails are available. You can still paste a Meet / Zoom / Teams / Webex URL for transcription-only joins.

Who can @mention the bot?
Org members only (email preferred). Externals get a denial—your product brain stays inside the team.

Does every spoken minute cost ChimpHands credits?
No. Join time is the $1/hour meter. Credits apply when you @mention for an LLM answer (or when LLM-backed redact / summarize runs).

Will adding more bots double my bill?
No for transcription / join time. Multiple personalities share one meeting session and one transcript.

Telemetry-Driven QA: Use Observability Data to Prioritize API Coverage

· 10 min read
Nuwan Samarasekera
Founder & CEO, TestChimp

TL;DR: We’ve shipped observability ingestion for API contract governance. Connect Datadog, Honeycomb, Amazon CloudWatch, or Google Cloud Monitoring to an OpenAPI service and TestChimp maps runtime routes to API operations, stores hourly and daily aggregate metrics, and brings request volume, error rate, status classes, and latency percentiles into the APIs surface.

The important part is not another dashboard. TestChimp’s QA workflows can now use the same telemetry to decide what to test next:

  • Uncovered, high-volume operations move up the functional coverage queue.
  • Uncovered operations with high error exposure move up faster.
  • High-p95 or high-p99 operations become candidates for performance-test creation and upkeep.

Production telemetry becomes a prioritization signal for QA—not a substitute for tests, and not an excuse to copy production traffic into a load profile.

Product guide: Observability in API Contract Governance.


Most QA backlogs know what is uncovered. They do not know what matters.​

OpenAPI coverage can tell you that 80 operations have weak coverage. Execution history can tell you that a test failed yesterday. A requirements graph can tell you which scenarios the team marked high priority.

All useful. Still incomplete.

If one uncovered endpoint handles 40% of production requests and another is called twice a month, they are not the same risk. If a mapped operation is returning errors on meaningful traffic, “we should test this someday” is no longer an honest prioritization. If p95 latency is already elevated, a green functional check does not answer whether the path stays healthy under concurrency or real tenant volume.

The usual QA process flattens these into one queue:

SignalWhat teams often doWhat a telemetry-driven process does
Missing API coverageSort by endpoint name or whoever complained lastRank by traffic and failure exposure
High error rateTreat it as an operations-only concernStrengthen negative-path and response-code coverage
Elevated p95 / p99Wait for an incident or quarterly performance passPrioritize a relevant k6 journey or upkeep
No telemetryAssume the endpoint is unusedMark it unknown; use business criticality and code evidence

Telemetry-driven QA closes that context gap. It uses production-like runtime evidence to optimize the order in which the QA process spends human attention, agent tokens, test runtime, and performance-environment budget.


What TestChimp now ingests​

TestChimp performs read-only aggregate queries against the configured observability provider. It does not copy raw traces, logs, request bodies, credentials, or customer payloads into the QA context.

The flow is:

  1. Discover observed routes from the previous 24 hours.
  2. Map method + route templates onto operations in the selected OpenAPI service.
  3. Surface unmatched runtime routes as Unmapped contract drift.
  4. Collect aggregate metrics for each completed hour.
  5. Store a complete prior-UTC-day summary with request count, average RPM, error count and rate, HTTP status classes, and p50 / p95 / p99 latency.
  6. Show the latest finalized daily summary in the APIs list, with the latest persisted hourly result as a fallback while daily data is not yet available.

That gives each mapped API operation two distinct evidence sets:

  • Contract coverage — which operations, fields, and response codes SmartTests or API tests actually exercised.
  • Runtime observability — how much traffic reached the operation, how often it failed, and how its latency was distributed.

Observability does not make an endpoint covered. Coverage does not prove the endpoint is important. Put them together and the QA queue gets much smarter.

Setup guides: Observability integrations · Datadog · Honeycomb · CloudWatch · Google Cloud Monitoring.


How should telemetry prioritize functional API coverage?​

Start with the coverage gap. Then use telemetry to order the queue.

1. Missing coverage is the eligibility signal​

Find operations with no covering tests or weak request-field, response-field, and response-code coverage. Intentionally ignored gaps stay out of the active queue.

2. Request volume is the impact signal​

Among uncovered operations, prioritize high request count or RPM. A regression on a hot operation has a larger blast radius than the same bug on a dormant path.

This does not mean “only test popular endpoints.” Authentication, billing, destructive actions, and compliance paths can remain critical at low volume. Telemetry improves ordering; it does not replace product judgment.

3. Error exposure is the urgency signal​

Raise operations with high error rate, high absolute error count, or meaningful 5xx traffic. Then inspect the contract detail:

  • Is the failing response code represented in the OpenAPI spec?
  • Does any SmartTest exercise it?
  • Are error-body fields and recovery behavior asserted?
  • Does the operation have an auth, role, validation, or state-transition branch that the happy path never reaches?

The goal is not to write one API test per metric. Prefer extending an existing UI or API test that already reaches the operation and can exercise the missing branch naturally.

4. Business criticality breaks ties​

Volume and errors are evidence, not governance. Use scenario priority, release scope, semantic coverage, incident history, and backend branch complexity alongside telemetry.

A practical ordering is:

missing coverage
+ request volume / error exposure
+ business criticality
+ distinct branch complexity

That is how /testchimp create tests, /testchimp run QA, and /testchimp upkeep now reason about API coverage when observability is available.


How should latency telemetry prioritize performance testing?​

Functional testing asks whether the operation behaves correctly. Performance testing asks whether the journey remains healthy under an approved workload and dataset.

Use runtime p95 and p99 latency to identify:

  • A slow operation with no corresponding k6 journey.
  • A hot operation whose performance coverage exists but has gone stale.
  • A high-error operation where latency, queueing, timeouts, or dependency behavior may be contributing.
  • A list, search, report, export, or history path that may need a volume test against a large seeded dataset—not merely more concurrent users.

The workflow mapping is deliberate:

  • /testchimp create-perf-tests authors a scenario-linked journey when a high-value operation has no useful performance representation.
  • /testchimp upkeep-perf reviews stale journeys, baselines, datasets, dependency mocks, and composite membership—with slow, high-volume, and high-error operations first.
  • /testchimp run-perf-tests can use the signal to choose among related journeys for a PR or release scope.

This is performance-test prioritization, not automatic capacity planning.

Production request rates do not become k6 VUs. Production p95 does not silently become a threshold. Absolute concurrency, duration, dataset cardinality, SLOs, and pass/fail limits still come from your capacity model and approved policy.

And production p95 is not directly comparable to test p95 unless environment, workload, time window, dataset, code/config, and dependency behavior genuinely match. Otherwise the comparison is directional context—not a regression claim.

Full workflow guide: Performance Testing Workflows.


Agents can consume the same evidence​

The APIs UI is not the end of the data path.

TestChimp’s API-operation list and detail APIs return observability mapping state plus the latest persisted runtime summary. The TestChimp CLI and MCP tools expose those same responses to agents:

list-api-operations
get-api-operation-detail

The summary includes its time window and sync status alongside request volume, errors, status classes, and latency percentiles. That matters because agents need to reason about data quality, not merely sort numbers.

Our skill playbooks now instruct QA workflows to:

  1. Fetch API contract coverage and runtime observations together.
  2. Check the observation window and sync status.
  3. Treat absent, stale, partial, no-data, or query-failed telemetry as unknown, not zero.
  4. Prioritize uncovered high-volume and high-error operations for functional coverage.
  5. Prioritize high-p95 / high-p99 operations for performance creation or upkeep.
  6. Keep production observations separate from test thresholds and baseline comparisons.

This is the useful version of “AI-powered testing”: not a model generating more scripts, but an agent allocating QA effort from evidence.


The optimization target is the QA process​

Observability platforms already help teams operate production. We are using the same aggregate evidence for a different question:

Given limited QA time and runtime, which uncovered behavior should we protect next?

That creates a tighter feedback loop:

OpenAPI contract
+
test coverage
+
runtime volume, errors, and latency
↓
prioritized QA workflow
↓
tests, fixtures, performance journeys, or accountable issues
↓
new execution evidence

The point is not to maximize test count. It is to optimize the QA process around expected impact.

This sits alongside TrueCoverage:

  • TrueCoverage uses semantic product events to show which user journeys, transitions, and world-state slices deserve protection.
  • API observability uses route-level volume, errors, and latency to show which contract operations deserve functional and performance attention.

Requirements say what should matter. Tests say what was proven. Telemetry says where the product is carrying real load and risk. Agentic QA gets better when it can reason across all three.


Frequently asked questions​

What is telemetry-driven QA?​

Telemetry-driven QA uses runtime signals such as request volume, error rate, and latency percentiles to prioritize test creation, maintenance, and execution. It optimizes which QA work happens first; it does not replace requirements, tests, or human risk policy.

Does TestChimp ingest raw traces or request payloads?​

No. TestChimp runs read-only aggregate queries and stores route mappings plus hourly and daily metric summaries. Raw provider events, logs, traces, and request bodies are not copied into TestChimp.

How does observability improve API test coverage?​

Among uncovered API operations, TestChimp workflows prioritize fresh high-volume and high-error operations, then inspect field and response-code gaps to extend an existing test or author focused coverage.

How does observability improve performance testing?​

p95 and p99 latency identify operations that need a k6 journey or performance upkeep. Request volume and error exposure strengthen that priority. Telemetry selects what to test; your policy still defines VUs, duration, datasets, and thresholds.

What happens when an operation has no observability data?​

It is unknown, not zero traffic. The workflow falls back to business criticality, scenario priority, code/release impact, semantic coverage, and execution history.

Can production latency be used as a k6 threshold?​

Not automatically. Production and test measurements usually differ in environment, workload, data, dependencies, and time window. Set k6 thresholds from explicit SLOs or an approved capacity policy, and compare runs only across compatible dimensions.


Try it​

  1. Configure API Contract Governance with your OpenAPI root.
  2. Connect an observability provider.
  3. Map its service/resource to the matching OpenAPI service and run Sync now.
  4. Open APIs and sort/filter coverage alongside RPM, error rate, and p95 latency.
  5. Use Create test, /testchimp create tests, or /testchimp upkeep for high-impact coverage gaps.
  6. Use /testchimp create-perf-tests or /testchimp upkeep-perf for slow, hot, or error-prone operations that lack current performance evidence.

Start here:

Do not let the test backlog decide its own order. Let evidence tell the QA process where risk is concentrated—then make the work accountable.

Launching TestChimp Studio: Your Desktop IDE for Software Delivery

· 7 min read
Nuwan Samarasekera
Founder & CEO, TestChimp

TL;DR: We shipped TestChimp Studio—the companion desktop app that is your IDE for software delivery. Going from “what are we building?” to “is it ready to ship?” no longer means jumping across a myriad of platforms and stitching context by hand. Studio consolidates requirement planning, agentic QA, release governance, issues, executions (E2E, API, performance, security, UX), coverage, and QA knowledge-base exploration in one local workspace. Built on OpenCode: use ChimpHands, bring your own LLM API key, or connect a local model. macOS, Windows, and Linux—or npx @testchimp/studio.

Product page: testchimp.io/studio. Docs: TestChimp Studio · Download.


The stitching tax​

Agentic QA is working. Teams already run /testchimp workflows, keep plans in Git, gate releases on evidence, and let automations start ChimpHands when something changes.

The remaining bottleneck is the workspace. Delivery still looks like this:

You needWhat you actually do
IntentWrite the story in a tracker, then re-explain it to an agent
ExecutionHop to an IDE, paste a prompt, lose the release and coverage tabs
EvidenceCI is green somewhere; perf is in another product; UX bugs live in a spreadsheet
GovernanceSomeone builds a slide that claims the version is ready
AlignmentNobody can see whether QA posture matches this plan and these users

Agents compressed doing the work. They did not invent a control pane that sits on your machine next to the repo.

Studio is that pane—in the convenience of a desktop app.


What is TestChimp Studio?​

TestChimp Studio is TestChimp’s companion desktop application. It is not a second product with a second source of truth. It is the same control plane as the web app, plus a local OpenCode agent runtime, so planning and execution share one window.

You can:

  • Plan requirements — organize stories and scenarios, then hand them to agents without leaving the workspace (requirement planning).
  • Run agentic QA — create tests, upkeep the suite, explore UX, implement a story—catalog workflows with full local checkout context.
  • Govern the release — test runs, checks, and readiness on the version you are about to push (release governance).
  • Track issues — agent-found and human-found, tied back to plans and executions.
  • See executions — E2E, API, performance, security, and UX evidence without a dashboard scavenger hunt.
  • Govern coverage — requirements, API schemas, real-user behaviour (TrueCoverage), and the gaps you should close next.
  • Explore the QA knowledge-base — stories, scenarios, tests, releases, issues, and how they relate (QA Brain / InfiniTrace).

The desktop binary is the shell + agent. The product UI still loads from your App URL and ships independently—so Studio does not freeze the product on whatever build you installed last month.

Full walkthrough: TestChimp Studio.


One workspace, the whole delivery loop​

If you have been living in the TestChimp loop, the pieces already exist as separate surfaces. Studio is the place they stop competing for focus.

Requirement (story / scenario)
↓
Agentic workflow (/testchimp create-tests, run QA, upkeep, …)
↓
Executions (SmartTests, API, k6, ExploreChimp, security)
↓
Coverage + issues (plans, schemas, RUM, QA Brain)
↓
Release (evidence, checks, ship / don’t ship)

QA can run autonomously—local agent now, cloud ChimpHands and automations when you want CI to do it overnight—while you keep complete transparency into posture and how it aligns with product intent.

That is the difference between “we have an agent” and “we have a delivery workspace.”


Your agent, your keys, your machine​

Studio is built on OpenCode. Settings → LLM is explicit about who pays for tokens:

PathWhat it is
ChimpHandsOur coding agent. QA-metered credits. Same catalog as cloud ChimpHands.
Bring your own keyOpenAI, Anthropic, ChatGPT/Codex OAuth, or another models.dev / OpenCode provider.
Local / custom URLPoint at a local or self-hosted model. No ChimpHands credits.

Studio starts one OpenCode serve for the active workspace and keeps the TestChimp skill current. You are not pasting mcp.json into a third IDE to get the catalog. You also are not required to burn a Cursor or Claude seat for every /testchimp upkeep you run at the desk.

Cloud ChimpHands stays the right executor for async CI. Studio is the right executor for interactive delivery on the laptop that already has the branch.


Why this matters in the agentic era​

We have argued that skills are SaaS distribution—the playbook travels with the agent. That automations close the routing gap. That requirements need governance before agents spend tokens. That release governance is the ship decision, not a spreadsheet.

Studio closes the attention gap.

Without it, the platform is still a tab, the agent is still another tab, and the repo is still a third window. With it, the control pane and the agent share a desktop—requirement planning all the way to a confident release push.

That is how you boil the QA lake without boiling your context-switching budget.


Frequently asked questions​

What is TestChimp Studio?​

TestChimp Studio is TestChimp’s companion desktop app—an IDE for software delivery. It consolidates requirement planning, agentic QA workflows, release governance, issues, test executions, coverage insights, and QA knowledge-base exploration in one workspace on your machine.

How do I download TestChimp Studio?​

Use the official Download TestChimp Studio page. Certified installers are on GitHub Releases for macOS, Windows, and Linux. Cross-platform: npx @testchimp/studio.

Does Studio replace the TestChimp web app?​

No. Studio loads the same product UI from your configured App URL. The web app remains the shared control plane and the URL you send a teammate. Studio adds the local shell and agent runtime.

How is Studio different from Cursor or Claude Code?​

Those IDEs are excellent for implementation. Studio is a delivery workspace: plans, releases, executions, coverage, and catalog /testchimp workflows sit next to the local agent. You can still use Cursor/Claude for feature work; Studio is where QA posture and product intent stay visible.

Can I use my own LLM or a local model?​

Yes. Settings → LLM supports ChimpHands, BYO API keys (OpenAI, Anthropic, ChatGPT OAuth, models.dev providers), and a custom base URL for local or self-hosted models. BYO and custom paths do not consume ChimpHands credits.

Is TestChimp Studio available on macOS, Windows, and Linux?​

Yes. Certified installers ship for those platforms, and npx @testchimp/studio runs on all three. See Download.

Do I need to re-map my project if I switch between npx and the installer?​

No. Certified builds and npm paths share ~/.testchimp and the same Electron userData.


Try it​

  1. Open Download TestChimp Studio
  2. Install via your platform’s certified build—or run npx @testchimp/studio
  3. Sign in and map a local project folder
  4. Open a story → create tests, or open Releases and look at the version you are about to ship
  5. Set Settings → LLM to ChimpHands, BYO, or local

Start here:

Your control pane for software delivery—now in the convenience of a desktop app.


Further reading​

TestChimp

Related posts

Concepts

Meet ChimpHands: TestChimp's Native QA Cloud Agent on Your CI

· 11 min read
Nuwan Samarasekera
Founder & CEO, TestChimp

TL;DR: We shipped ChimpHands—TestChimp's native QA cloud agent. It runs on your GitHub Actions runner (full code checkout, your secrets, your branches), executes the same /testchimp workflows you already use locally, and stays wired into the platform for automations, workflow executions, and live chat. Skill + CLI are packaged on every run—no mcp.json wiring per host. Attach stories, scenarios, issues, releases, and batch invocations from chat; add repo line ranges, upload local files, and co-edit in the diff pane. Built on OpenCode with GPT 5.6-range models tuned for cost-effective QA—not your Cursor or Claude dev subscriptions. The differentiator: async runs and interactive clarification share one session. Fire an automation overnight; jump into the same ChimpHands chat when the agent needs you. One-click setup.

Full docs: ChimpHands.


The wrong agent for the job (and the wrong bill)​

Agentic QA is working. Teams run /testchimp fix-issue, /testchimp upkeep, /testchimp author-plans—and Automations route those workflows when issues, batches, and releases change.

But the executor still matters:

PainWhat teams feel today
Subscription bleedNightly fix-test-execution and upkeep burn Cursor / Claude seats meant for implementation
Wiring taxLabelled GitHub issues, MCP dashboards, per-provider secrets—different path per agent product
Async vs interactiveFire a cloud job, wait for a PR—or sit in a separate chat UI. Clarification mid-run means a new conversation and lost context
Opaque spendDev-agent invoices mix feature work with QA housekeeping; hard to budget "spend on QA?"
Thin audit trailExternal agent UXs don't always line up with TestChimp workflow executions and policy versions

We built ChimpHands to be the native answer: QA workloads on your CI, orchestrated by TestChimp, metered for QA, traceable at the workflow level.


What is ChimpHands?​

ChimpHands is TestChimp's own cloud agent for QA—not a generic coding-agent integration you bolt on later.

  • Runs on your repo's GitHub Actions runner — not on TestChimp VMs. The agent checks out your branch, uses your tree, and opens PRs from CI.
  • Full code context — same environment your SmartTests and policies already live in.
  • Same workflow catalog — fix-issue, implement, upkeep, author-plans, instrument-truecoverage, run-qa, and the rest. One skill, one MCP, one workflow-execution-id timeline.
  • OpenCode + TestChimp skill — each job installs OpenCode and @testchimp/cli, clones testchimp-skills, and runs testchimp chimphands serve.
  • Cost-optimized models — LLM traffic routes through GPT 5.6-range models suited to playbook-driven tool use, not always the priciest frontier tier.

Think: the QA agent your platform already knows how to schedule, audit, and budget.


Platform context and IDE-agent ergonomics—without the wiring tax​

BYO cloud agents mean committing mcp.json, configuring MCP in Cursor/Copilot dashboards, and pasting issue ids into prompts. ChimpHands ships differently:

Packaged on CI: every job installs OpenCode, @testchimp/cli@latest, and clones testchimp-skills. You set TESTCHIMP_API_KEY once as a GitHub secret—not per-agent MCP setup.

Platform entities in chat: the composer + menu attaches removable tags for stories, scenarios, issues, tests, releases, and automation batches—searchable pickers, stable ref: lines in the outbound prompt (ordinal ids where applicable). Handoffs from Plans and Issues can pre-fill that context.

Repo + file parity with typical agents:

CapabilityChimpHands
Line ranges in repo filesSelect in diff/content pane → context tag
Whole filesRepo explorer, drag from changed-files list
Upload local contextArtifact upload → short-lived URL in prompt
Live diffs + human editsSide pane writes back to the CI worktree

So you get the "attach the failing test batch and lines 42–88 of checkout.spec.ts" workflow—native to TestChimp, not duct-taped through a generic coding-agent product.

Details: Chat with platform and repo context.


How it runs (one-click, then forget)​

Setup is deliberately boring—in a good way:

  1. Connect the TestChimp GitHub App and map your repository.
  2. Open ChimpHands in the sidebar → install .github/workflows/chimphands.yml (direct commit or PR if branch rules require it).
  3. Add TESTCHIMP_API_KEY as a GitHub Actions secret.

After that, ChimpHands sessions start from chat, Plans (Spec out / Scope out / Implement / Test), Issues, or Automations when you pick ChimpHands as the invocation strategy.

Trigger (automation / chat / Plans handoff)
↓
ChimpHands session + workflow execution
↓
GitHub Actions: checkout → OpenCode → TestChimp skill → /testchimp …
↓
Tunnel ↔ TestChimp UI (stream tools, diffs, messages)
↓
Pull request + Done / Failed in Workflow Executions

You can always drop to the GitHub Actions run for raw logs. The product UI is for humans; CI is the source of truth for the run.

Mechanics: How ChimpHands runs.


Async → in-convo without losing the thread​

Most cloud agents force a tradeoff:

  • Async: great for overnight upkeep, terrible when the agent hits an ambiguous requirement at 2am.
  • Interactive: great for pairing, terrible for "fix every failed batch without me watching."

ChimpHands bridges both on one session id:

ModeExperience
AsyncAutomations dispatch; optional human gates before invoke or plan execute; you review the PR when done
InteractiveOpen ChimpHands chat; watch reasoning, tool calls, and file diffs live from CI
Async → in-convoAgent pauses for clarification; you reply in the same ChimpHands UI; the runtime on CI picks up your message and continues

External agents (labelled issues, separate cloud UIs) usually break continuity here—you re-paste context or start over. ChimpHands keeps one session, one workflow execution, one Actions run.

That's the seamless human-in-the-loop story we wanted for policy-traceable workflows: attend when it matters, ignore when it doesn't—without losing the audit trail.


Why separate QA agent economics​

ChimpHands metered usage enables you to have your QA workloads isolated from dev-agent subscriptions.

Your Claude Code and Cursor seats stay for implementation. ChimpHands credits cover the long tail:

  • Fix failing SmartTests after CI
  • Windowed upkeep digests
  • author-plans with full repo context
  • TrueCoverage instrumentation and gap fixes
  • Release run-qa composites

You set a QA budget per billing cycle. The platform enforces gates before metered runs and shows remaining credits in-product. Within that budget, ChimpHands aims for the best feasible protection—high-signal automations first, predictable spend, fail-closed when credits run out.

Value prop deep dive: Why ChimpHands.


Automations, now native​

When we shipped Workflow Automations, the missing piece was a first-class executor that didn't require you to operate another agent product.

ChimpHands is now the recommended invocation strategy:

SignalWorkflowChimpHands fit
High-severity issuefix-issueFull bug context + repo checkout → PR
Story / scenario → readyimplementPlan-execute gates + same session for clarifications
CI batch failedfix-test-executionBuffered aggregation → one run per push
Release → Readyrun-qaComposite QA without pasting prompts
Steady hygieneupkeepWindowed overnight digests

Configure once under Workflows → Automations, choose ChimpHands, tune aggregation and gates. Same workflow-execution-id reporting as local /testchimp.

Recipes: Typical automation setups · Best practices.


ChimpHands vs bring-your-own cloud agents​

ChimpHandsGitHub Issue / Webhook
SetupGitHub App + one workflow fileSkill, MCP, secrets, per-agent docs
HostYour GitHub Actions runnerVaries (Copilot, Codex Action, custom)
Platform UXNative chat + execution timelineExternal UI or issue thread
CostChimpHands credits (QA-metered)Your agent provider's billing
Default?YesWhen you must keep an existing stack

Bring-your-own paths remain: Cloud agents · Setting up cloud agents.


Why this matters in the agentic era​

We've argued that skills are SaaS distribution—the playbook travels with the agent. That automations close the routing gap—events in, workflow executions out. That requirements need governance before agents spend tokens.

ChimpHands closes the executor gap: a cloud agent that is of TestChimp, on your CI, for QA economics.

Local Cursor / Claude for the interactive dev loop. ChimpHands for the overnight fix, the failed batch, the ready story, the release gate—and for jumping into the same session when the agent has a question.

That's how you boil the QA lake without standing next to every kettle or duct-taping five agent products together.


Frequently asked questions​

What is ChimpHands?​

ChimpHands is TestChimp's native QA cloud agent. It runs catalog /testchimp workflows on your GitHub Actions runner with full repository context, OpenCode, and the TestChimp skill—reachable from automations, Plans, Issues, and in-product chat.

Where does ChimpHands run?​

On your GitHub Actions infrastructure. TestChimp dispatches .github/workflows/chimphands.yml; the job checks out your branch and executes the workflow there. TestChimp orchestrates sessions and streams UI updates over a tunnel—it does not host your source code.

How is ChimpHands different from Cursor or Claude for QA?​

ChimpHands isolates QA spend from dev-agent subscriptions, uses cost-optimized GPT 5.6-range models for playbook-driven work, and ties every run to workflow executions in TestChimp. Use Cursor/Claude for IDE pair-programming; use ChimpHands for async QA, automations, and repo-context plan authoring.

How does human-in-the-loop work?​

Automations can run fully async. If the agent needs clarification, open the same ChimpHands session in TestChimp chat—your reply reaches the CI runtime and the turn continues without a new conversation or copy-pasted context.

How do I set up ChimpHands?​

Connect the TestChimp GitHub App, map the repo, install the ChimpHands workflow from the ChimpHands page, and add TESTCHIMP_API_KEY as a GitHub Actions secret. Step-by-step: ChimpHands intro.

Does ChimpHands replace local /testchimp?​

No. Local agents with the TestChimp skill remain ideal for fast iteration and heavy IDE work. ChimpHands is the native cloud path—especially for automations and fire-and-forget QA runs.

Can I still use GitHub Issue or Webhook automations?​

Yes. ChimpHands is the recommended default. Via GitHub Issue and Webhook stay available for bring-your-own agent stacks.

Do I need to commit mcp.json for ChimpHands?​

No. The Actions job installs the TestChimp skill and @testchimp/cli on every run. You only need TESTCHIMP_API_KEY as a GitHub secret—unlike BYO cloud agents that require per-host MCP configuration.

Can I attach platform entities and file ranges in chat?​

Yes. Tag stories, scenarios, issues, tests, releases, and automation batches from the composer + menu; add repo line ranges or whole files from the diff pane or explorer; upload local files as artifacts. Edit files collaboratively in the side pane when the runtime allows.


Try it​

  1. Open ChimpHands in your TestChimp project sidebar
  2. Connect GitHub and Install the workflow (direct or via PR)
  3. Add TESTCHIMP_API_KEY to GitHub Actions secrets
  4. Start a chat session—or create an automation with ChimpHands as invocation strategy
  5. Watch Executions → Workflow Executions (and join chat if the agent asks)

Start here:

When QA work needs doing, the agent should already be on your CI—not eating your dev subscription or waiting for you to wire another product.


Further reading​

TestChimp

Related posts

Concepts

Verified Tests: When Agents Write the Coverage, Trust—but Verify

· 6 min read
Nuwan Samarasekera
Founder & CEO, TestChimp

TL;DR: Agents built the product. Agents authored the tests that verify the implementation. The missing piece is accountability—has anyone actually looked at the test to ensure it truly verifies the scenario? Verified Tests puts that sanity check in the platform: inspect screen captures, steps, and code, then stamp a Verified Badge on the covering scenario.

Full product guide: Verified Tests.


The missing piece is accountability​

Agents are very good at getting a path green.

The SmartTest runs. The scenario is linked. Requirement coverage looks healthier than last sprint.

That is not the same as: this test actually verifies the behaviour the scenario describes.

Has anyone actually looked at the test?

A scenario annotation is cheap to add—and agents add them at speed. They can link the right scenario to a script that asserts a toast, skips the important check, or walks a cousin flow that happens to share a button. The dashboard still counts it as coverage.

We used to paper over that with implicit knowledge: the person who wrote the test was the person who knew what it proved. Agents broke that assumption. Volume went up. Inspection did not.

Failure modeWhat goes wrong
Linked ≠ provenThe test is tagged to a scenario but never asserts the expected outcome
Happy-path impersonationA green run for a neighbour flow masquerades as coverage of the hard one
Unowned claimsCoverage reports “covered”; nobody can say who looked at the script

Green is an execution fact. Linked is a mapping. Verified is the accountability layer: a person has sanity-checked that the covering test truly verifies the scenario.

That is the problem Verified Tests solves.


Why this is necessary in the agentic era​

Before agents, test authoring was slow enough that “who wrote this?” was a reasonable proxy for “who checked this?”

That proxy is dead.

Agents implement. Agents author SmartTests. Agents attach scenario ids because the plan files told them to. You still need a durable record that a person opened the execution, looked at what actually happened, read the script, and agreed: yes, this test verifies that scenario.

Otherwise requirement traceability is a spreadsheet of claims with nicer UI. Coverage insights tell you what ran. They do not tell you whether the test is the right test.


Introducing Verified Tests​

TestChimp now lets you Verify tests in the platform—without bouncing out to a repo or a recording elsewhere.

Open a SmartTest execution and you already have what you need to make an informed decision:

  • Screen captures from the run
  • Steps the test actually took
  • The code, via View Test, so you can read the script next to the evidence

Then use the check badge next to the SmartTest name. Same visual language as a verify badge elsewhere on the internet, because the job is the same: this was inspected.

Three states on the test:

  • Hollow — none of the linked scenarios are verified
  • Grey — some, not all
  • Blue — every linked scenario for that test is verified

For one scenario, you confirm. For several, you verify per scenario—or Mark all as verified. Hover a filled badge and you see who verified it.

Un-verify is deliberate: it records manually unverified, not “never happened.” The audit trail stays.

Status lives in TestChimp, not in source. Agents can keep authoring Playwright. Humans stamp the claim when they have actually looked.


A Verified Badge on scenario coverage​

Plans, requirement coverage, and test runs already show recent execution results per scenario.

You now also see a Verified Badge on each scenario—an extra layer of assurance that the product is being tested properly, not only that something ran green.

  • Filled — a user has sanity-checked a covering test for that scenario
  • Hollow — the scenario has tests, but nobody has inspected them yet
  • Omitted — no linked tests, so there is nothing to verify

Clicking the coverage-side badge does not flip the bit. It tells you how: open an execution, inspect the run, then use the check badge next to the test name. Verification is an inspection action, not a bulk paint on a dashboard.

That is the point. If it were too easy, we would have rebuilt the original lie at a larger scale.


How this fits the rest of TestChimp​

If you’ve been following along:

Planned reality → linked automation → inspected coverage → release confidence. The middle of that chain was the hole once agents started writing both sides.


Frequently asked questions​

What is a verified test?​

A verified test in TestChimp is a SmartTest a project member has inspected and confirmed actually covers a linked scenario. It is more than a green run or a scenario annotation: someone looked at the screen captures, steps, and code, and stamped the claim.

How is verified different from linking a test to a scenario?​

Linking (a Playwright annotation with type: 'scenario' and #TS-<n>) is a coverage claim. Verification is a human sanity check of that claim. You can have linked, green, and still unverified.

Where do I verify a SmartTest?​

Open a SmartTest execution (click a coverage square). Inspect the screen captures, steps, and test code, then use the check badge after the test name. Coverage-train badges are read-only hints.

What does the Verified Badge on a scenario mean?​

A filled badge means at least one covering SmartTest has been manually verified for that scenario. Hollow means tests exist but have not been sanity-checked yet. No linked tests → no badge.

Does renaming a scenario reset verification?​

No, as long as the scenario ordinal (#TS-n) stays the same. Linking a different scenario is a new claim and starts unverified.

Can I un-verify?​

Yes. Confirming un-verify sets the link to manually unverified (distinct from never verified). Who/when hover applies to the verified state.

What if the test has no linked scenarios?​

It cannot be marked verified. There is no scenario claim to inspect. Link the scenario first.


When agents run your SDLC, trust—but verify.

Docs: Verified Tests · Link tests to scenarios · Requirement traceability.

Performance Testing for Agentic Teams: Journeys, Composites, and Comparable Runs

· 7 min read
Nuwan Samarasekera
Founder & CEO, TestChimp

Agent coding is very good at getting the feature to work.

A user can check out. The API returns 200. The SmartTest is green. You merge.

Then ten concurrent checkouts queue behind one chatty query. Or the reports page, which was snappy with three invoices in the seed DB, falls over on a tenant that actually uses the product.

That gap is not a mystery. Agents optimize for the path in front of them—one user, empty-ish data, mocked collaborators that return in 0 ms. Concurrency and data volume are different questions. Functional tests do not answer them.

So we shipped performance testing as a first-class TestChimp surface: k6 in your repo, agentic workflows that author the right journeys (and keep composites honest), related runs after a PR or a release, and an Executions view that compares this run to a prior one.

Full product guide: Performance Testing.


The questions that actually matter​

Not “did k6 print a chart.” The questions product and eng already have:

You want to knowWhat we run
Will this path hold if traffic shows up together?Load journeys (many VUs)—not a bigger dataset
Does this page still work when the tenant already has history?Volume journeys (cardinality / records)—not more users
Did this PR make checkout slower than last week?Related journeys, then compare to a matching prior run
Can the evening mix still breathe if we add this journey?A composite with an explicit membership/weight—absolute load stays a separate decision

We keep load and volume as separate axes. “Make it heavier” by turning both knobs hides which one broke.


Agents author journeys. You still own capacity.​

/testchimp create-perf-tests does not invent a k6 file from vibes.

It ranks real scenarios (priority, semantic coverage, get-requirement-coverage --include-perf). It uses redacted REAL E2E interaction shapes—method, path template, schema, status class, timing distribution—not cookies, tokens, or production bodies. When TrueCoverage is mature, relative demand helps order the queue and suggest composite weights.

What it will not do: copy a production RPS into load.js. TestChimp telemetry tells you what is worth testing. You (or run-perf-tests.policy.md) still set VUs, duration, and dataset size. Smoke is the default while authoring. Load/volume wait on an explicit capacity decision.

Composites are a weighted mix of journeys—“typical overall load,” not isolated degrade detection. Adding a journey to a composite is always a prompted approval. Silent membership is how you accidentally change the mix and then argue about the chart.

Outbound deps (payments, email, LLMs, partner APIs) get harness mocks with realistic latency. Hitting Stripe in a load test is expensive and flaky. Stubbing it at 0 ms is worse: you never see pool exhaustion. Either outcome is false confidence.

Folder layout, metadata, and wrappers: How performance tests are organized.


Perf load/volume does not execute inside /testchimp test. Functional smoke should stay fast. k6 execution is /testchimp run-perf-tests or CI k6/scripts/run.sh. Run QA does write plans/smart-smoke/<branch>/related-perf-tests.json when k6/journeys exists, so the next CI --impacted run picks up the affected journeys.

On a PR, we select related journeys from the change set—scenarios, operations, path templates—then run them through k6/scripts/run.sh --impacted. Bare k6 run is not a TestChimp run: no ingest, no Executions charts.

On a release, the prompt from the release page is:

/testchimp run performance tests for release 1.2.0

The git range is prior SHA → cut SHA, not whatever happens to be checked out. Ingest stamps TESTCHIMP_RELEASE so the release panel and Executions list light up. If existing journeys do not cover that range, the agent asks whether to author (nested create-perf-tests on the same range) instead of silently inventing a suite or pretending coverage exists.

/testchimp upkeep-perf is the long loop: stale scenario links, drifted contracts, composite membership, thresholds that should not be quietly weakened to make compare green.

/testchimp init-perf scaffolds k6/ once. /testchimp import-perf-tests brings Locust/JMeter/Gatling/Artillery/k6-from-elsewhere into that tree. Source VU counts stay out of load profiles until you approve capacity.

Workflow walkthrough: Performance testing workflows.


Results you can overlay, not a one-off HTML report​

Wrapper runs ingest a summary and attach downsampled timeseries (p95, fail rate, VUs, and the rest of the k6 dump). Executions → Performance Tests lists them—optionally grouped by batch. Open a run for threshold, p95, fail rate, duration, metric-over-time, and VUs.

Performance regression on checkout-journey: overlay the prior release and the p95 gap is obvious

Then click Add Comparison Run. Recommended candidates share the comparison keys (environment, profile, dataset, LLM mode, mock/latency profile). The overlay re-bases both series on elapsed time so you are not comparing Tuesday 4pm wall clock to Wednesday 9am.

That is the degrade question: same kind of run, previous comparable result, is this worse? Green against a loose threshold can still be a regression versus last Tuesday. CLI compare-perf-to-baseline is the same contract for agents and CI—it exits nonzero when comparison.regressed is true. A mismatched baseline is incomparable, not a pass.

Viewing results.


How this fits the rest of TestChimp​

If you’ve been following along:

  • SmartTests (now grouped as Functional Testing in the docs) prove the path works for a user
  • Smart Smoke keeps that suite runnable in a CI budget
  • TrueCoverage says which journeys real people actually take
  • Performance testing asks whether those journeys still hold when many people take them—or when the tenant already has history

Planned reality → functionally tested reality → load/volume-tested reality → production reality. The middle was the hole for teams whose agents ship faster than anyone can stare at an EXPLAIN plan.


Frequently asked questions​

What is TestChimp performance testing?​

Grafana k6 scripts in your mapped tests folder (k6/journeys and k6/composites), authored and selected by agentic workflows, ingested into Executions so you can chart a run and overlay a comparable prior run.

Do I need this if my SmartTests are green?​

Yes if you care about concurrency or tenant data volume. Agents (and humans) routinely ship designs that are correct for one user on a small seed database and fail under the conditions production actually creates.

Does /testchimp test run k6?​

No. Keep functional PR smoke fast. Use /testchimp run-perf-tests (or a dedicated CI job that calls the same wrappers).

Will TestChimp pick my VU count from production traffic?​

No. TrueCoverage and interaction timings are relative signals—what to test, how to weight a mix. Absolute VUs, RPS, duration, and dataset size come from policy or an explicit approval.

How do I see if we got slower?​

Open the run → Add Comparison Run → pick a recommended candidate. Or compare-perf-to-baseline in CI. Compare only matching environment / profile / dataset / mock profile.

Docs: Intro · Organization · Workflows · Results.

Concept: What is load testing? · Volume testing · k6 vs JMeter vs Locust · Compare across releases.

Smart Smoke: Max Semantic Coverage Within Your CI Time Budget

· 3 min read
Nuwan Samarasekera
Founder & CEO, TestChimp

Your agents have been writing tests for a few months, and now you have 500+ E2E tests taking an eternity to run. Sounds familiar?

Say hello to Smart Smoke.

With agents authoring tests en masse, the problem has changed. Coverage gaps close fast—but:

  • Your CI bill keeps growing as you run the full suite on every PR
  • Worse, you wait hours before knowing if anything broke

Today, smoke suites are often manually managed. Tag lists. Folder filters. A @smoke set someone curated last quarter. That leaves a lot of useful signals on the table—especially as test suites grow at an unprecedented pace.

What really interested me here—as a lover of algorithms—was that this is essentially a classic optimization problem:

Given N minutes, how do you maximize semantic coverage + PR impact?


First: find what the PR can break​

An agent identifies the tests relevant to the change—impacted scenarios from your plans, linked SmartTests via scenario annotations, plus anything newly authored on the branch. That related set lands in plans/smart-smoke/<branch>/related-tests.json.

Related tests on the semantic plane

That’s the seed. Then comes the fun part: covering as much ground as possible.


Paint the canvas within a fixed budget​

Imagine your tests laid out as nodes on a semantic canvas. The problem becomes:

Paint the canvas by selecting test nodes to maximize the covered spread—within a fixed time budget.

Pack max semantic coverage into the budget

We don’t just grab the nearest cluster. We iteratively pick the next test that adds the most new ground—so selection spreads across the plane instead of camping in one corner.


Then weigh the terrain​

Pure geometry isn’t enough. We weigh the terrain using signals like scenario priority, recency, test stability, execution time, historical failures—so packing prefers tests that are both informative and practical.

Weighting signals

Seeds always include related tests, tagged smoke (e.g. @smoke), and newly authored branch tests. Packing fills whatever budget remains—until the bin is full.

Execution time budget filled

The result: the best subset of tests to run as smoke for a given PR—giving you the most confidence within a fixed time budget.

Less CI cost. Less waiting. More confidence.


Same Playwright command​

Smart Smoke isn’t a new runner. You keep your SmartTests and the same npx playwright test—opt in per run:

export TESTCHIMP_SMART_SMOKE_ENABLED=true
# optional: time budget, suite %, tags, related-tests-only
npx playwright test

Non-selected tests skip with reason smart-smoke (distinct from an explicit test.skip).

ModeBest for
Related-tests-onlyTight PR confidence (safe agent default)
Budgeted smokeBroader ROI within a time / count / suite-% cap

It plugs into /testchimp test as Phase 5, or standalone via /testchimp run smart smoke.

Full reference: Smart Smoke Runs · How it works · Configuration.

Plugin: @testchimp/playwright (≥ 0.2.20).

Smoke responsibly.